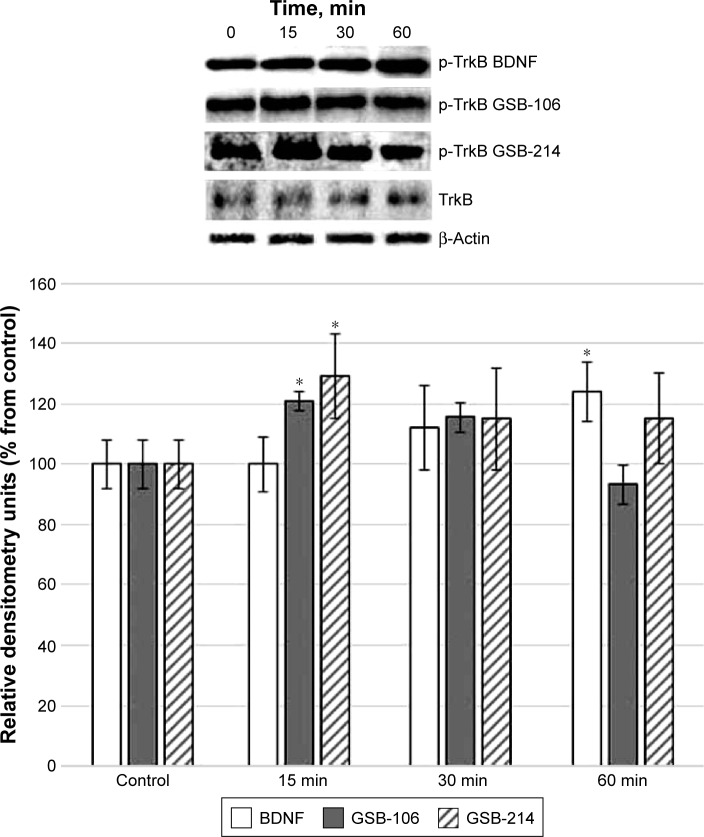
Figure 1.
Western blot analysis of TrkB phosphorylation in HT-22 hippocampal neurons at different times (15, 30, and 60 min) after incubation with GSB-106 (10−8 M), GSB-214 (10−7 M), or BDNF (10−9 M).
Notes: Bar graphs represent the intensities of phosphorylated TrkB quantified by scanning densitometry of blots, and these intensities are expressed as percentages relative to controls. Total non-phosphorylated TrkB arbitrary densitometric units were analyzed separately against β-actin. Data are presented as the mean ± SD of 5 independent experiments. Differences from the controls were significant at *P<0.05 (Mann–Whitney U-test).
Abbreviations: BDNF, brain-derived neurotrophic factor; GSB-106, bis-(N-monosuccinyl-l-seryl-l-lysine) hexamethylenediamide; GSB-214, bis-(N-monosuccinyl-l-methionyl-l-serine) heptamethylenediamide; SD, standard deviation; min, minutes.

