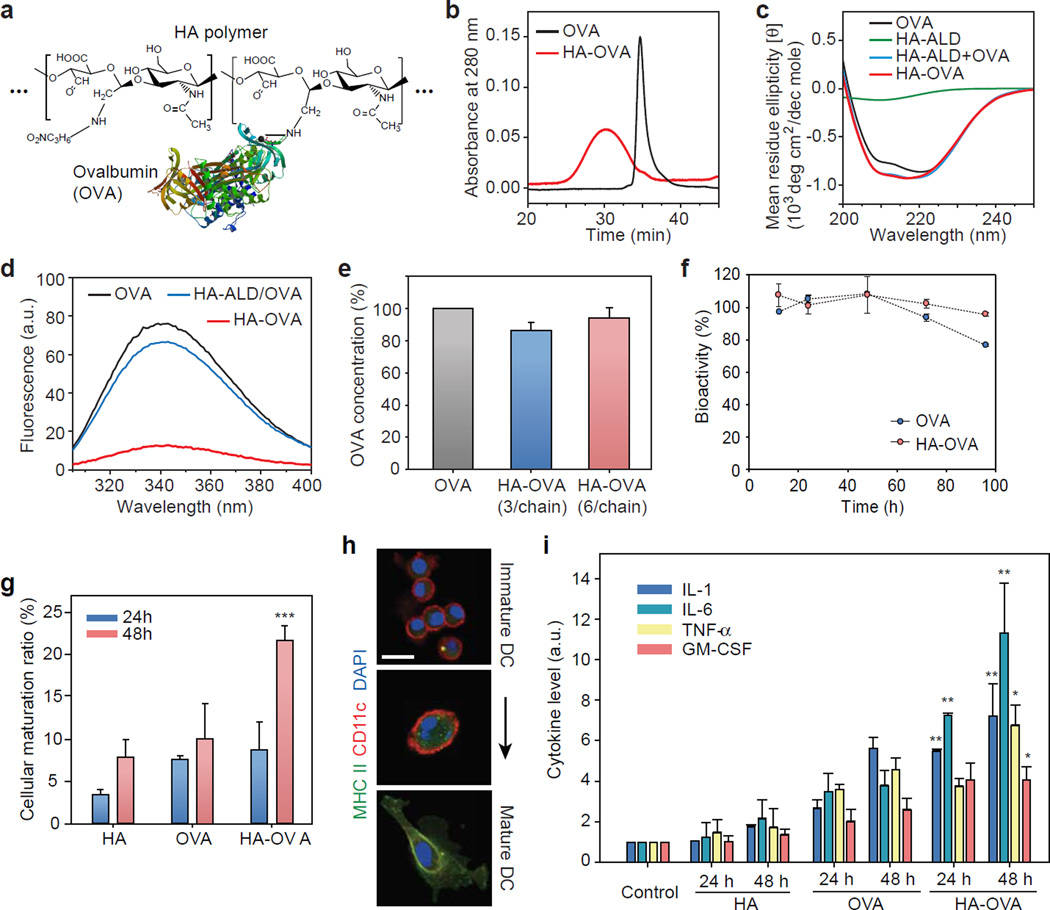
Figure 2.
Characterization of HA-OVA conjugates. (a) The chemical structure of HA-OVA conjugates. (b) Gel permeation chromatograms of OVA (black) and HA-OVA conjugate (red). (c) Circular dichroism spectra of OVA (black), HA-ALD (green), the mixture of OVA and HA-ALD (blue), and HA-OVA conjugate (red). (d) Fluorescence emission spectra of OVA (black), the mixture of OVA and HA-ALD (blue), and HA-OVA conjugate (red). (e) The ratio of bioactive OVA in HA-OVA. Error bars, s.d. (f) In vitro stability of OVA and HA-OVA conjugates in human serum. (g) The ratios of matured JAWS II cells 24 and 48 h after treatment with OVA, HA and HA-OVA conjugate, respectively (mean ± SD, n = 5). **, P < 0.01, w.r.t. HA-OVA. (h) Confocal fluorescence images of immature and matured DCs stained with anti-MHCII–Alexa 488 (green), anti-CD11c–Alexa 647 (red), and nuclear-dye Hoechst (blue). (i) Cytokine levels measured by ELISA from JAWS II cells treated with OVA, HA and HA-OVA conjugates for 24 h and 48 h (mean ± SD, n = 5). *, P < 0.05; **, P < 0.01, HA-OVA vs. other groups. Scale bars, 10 µm in (h).

