Figure 2.
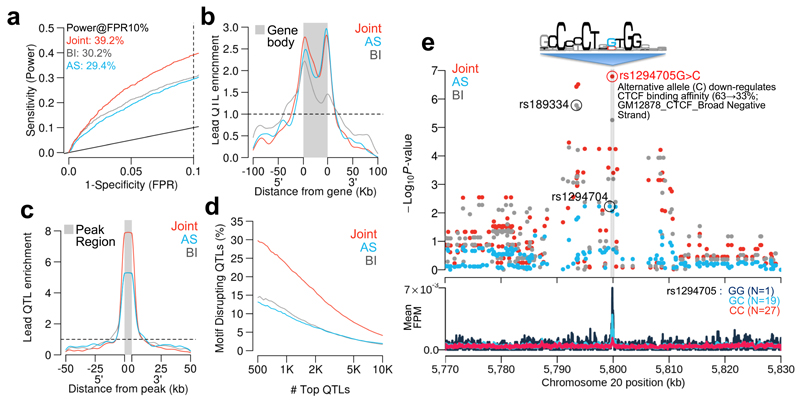
Comparing between-individual only (BI), allele-specific only (AS) and combined models. In panels a-d, red curves indicate the joint RASQUAL model, blue indicates the AS only signal and grey indicates the between-individual only signal. (a) ROC curves for detecting known eQTL genes (see Online Methods) for the three different models in a random subset of 24 individuals from gEUVADIS RNA-seq data1. Dotted line indicates FPR=10%. (b) Density plot shows the enrichment of top 1,000 lead eQTLs relative to the gene body and 5’/3’ flanking regions. (c) Density plot showing positional enrichment of the lead CTCF QTL SNPs near the CTCF peak, relative to all SNPs, aggregated over the top 1,000 detected CTCF QTLs. (d) The percentage of motif-disrupting lead SNPs in top N CTCF binding QTLs. Motif-disrupting SNPs were defined as SNPs located within a CTCF peak and putative CTCF motif, whose predicted allelic effect on binding, computed using CisBP position weight matrices2, corresponded to an observed change in CTCF ChIP-seq peak height in the expected direction (see Online Methods). Ordering of the top QTLs was based on their statistical significance independently measured by the three models. (e) Regional plot of P-values around an example CTCF binding QTL (top panel) and CTCF ChIP-seq coverage plot stratified by the lead SNP detected by the joint model (rs1294705) (bottom panel). The sequencing logo (Accession M4325) was derived by the CisBP database analysis of ENCODE CTCF ChIP-seq for GM12878 conducted by Broad Institute.

