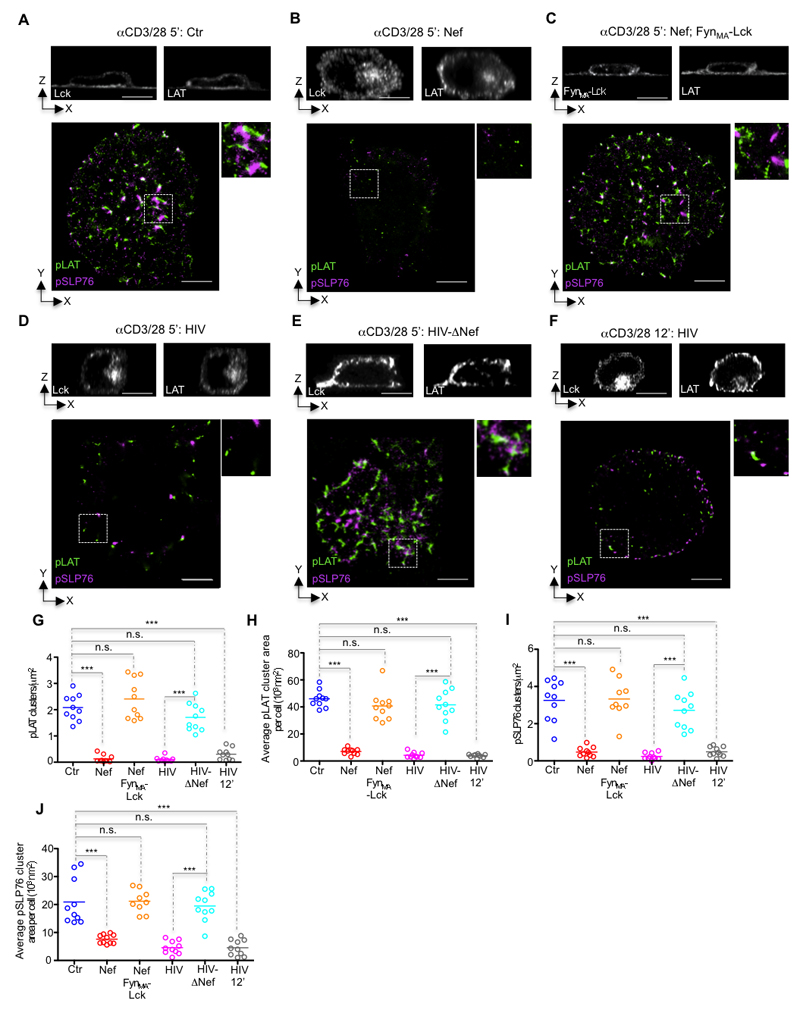
Figure 4. Nef co-opts the switch-like function of synaptic Lck in promoting TCR signal amplification.
(A-F) Top, confocal orthogonal view and bottom, dSTORM-TIRF images of control (A), Nef expressing (B), Nef and FynMA-Lck co-expressing (C), HIV (D, F), or HIV-ΔNef infected (E) Jurkat cells fixed while interacting with glass coated with antibodies against CD3 and CD28 (CD3/28) for 5 min (A-E) or 12 min (F) and immunostained for Lck and/or LAT (top) or for pLAT (green) and pSLP76 (magenta) (bottom).
(G-J) Population analysis quantifying the effect of Nef on (G) the number of clusters of pLAT per square micrometer, (H) the mean pLAT cluster area per cell, (I) the number of clusters of pSLP76 per square micrometer and (J) the mean pSLP76 cluster area per cell, measured by super-resolution microscopy in cells treated as in (A-F) for n≥9 cells per experimental condition.
Each symbol represents a cell. Scale bar 5 μm. Data are representative (A-E) or represent (G-J) 2 independent experiments.

