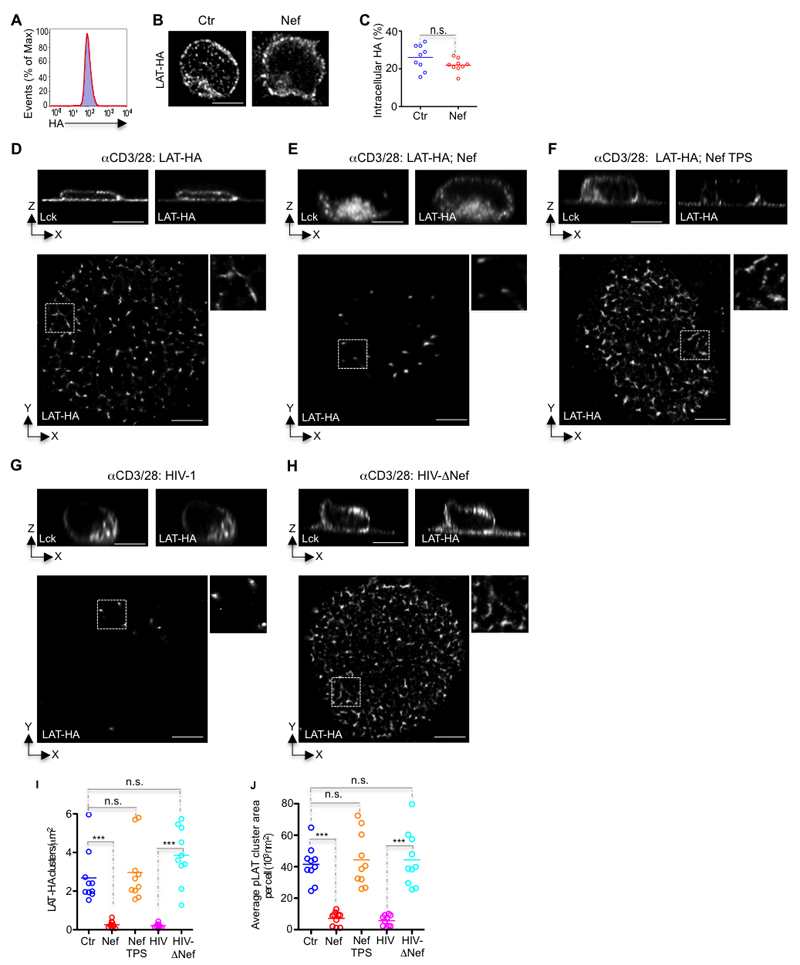
Figure 6. Nef impairs the formation of Ca2+ membrane territories controlling the signaling nanoarchitecture at the immunological synapse.
(A) Cytofluorimetry of the expression of LAT-HA in control (blue shaded histogram) and Nef-expressing Jurkat cells (red line) and labeled with mAb to HA.
(B) Deconvoluted confocal images illustrating the absence of Nef effect on the subcellular distribution of LAT-HA.
(C) Population analysis quantifying the absence of Nef effect on the subcellular distribution of LAT-HA, measured by 3D fluorescence intensity in the vesicular compartment relative to total fluorescence.
(D-H) Top, orthogonal view and bottom, dSTORM-TIRF images of control (Ctr) (D), Nef transfected (Nef) (E), Nef-transfected and thapsigargin treated (Nef TPS) (F), HIV-1 infected (HIV) (G), or HIV-1 ΔNef infected (HIV-ΔNef) (H) Jurkat cells expressing LAT-HA, fixed while interacting with glass coated with antibodies against CD3 and CD28 for 5 min and immunostained for Lck and HA (top) or surface LAT-HA nanoclusters (bottom).
(I, J) Population analysis quantifying the effect of Nef on (I) the number of clusters of LAT-HA at the synaptic membrane per square micrometer and (J) the mean area of LAT-HA cluster at the synaptic membrane for n=10 cells per experimental condition, measured by super-resolution microscopy in cells treated as in (D-H, bottom).
Each symbol represents a cell. Scale bar 5 μm. Data are representative (A, B, D-H) or represent (C, I, J) 3 independent experiments ***P ≤ 0.0001; n.s. not significative (Mann-Whitney test).

