Fig. 2.
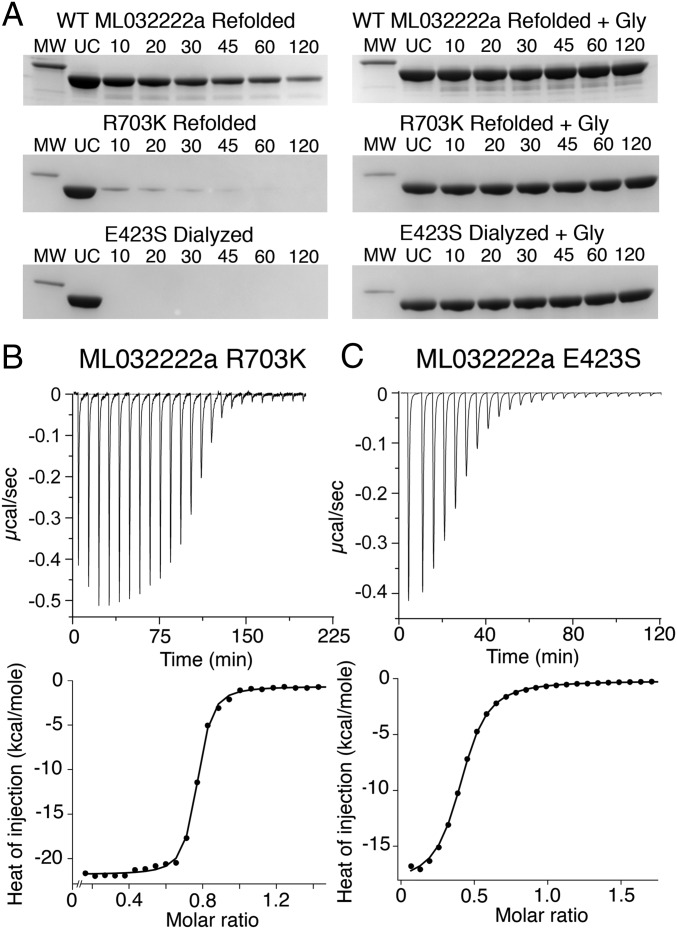
Salt bridge mutants lower affinity for glycine. (A) Proteolysis protection assays for refolded WT ML032222a S1S2 (Top); refolded R703K mutant (Middle); and exhaustively dialyzed E423S mutant (Bottom). (Left) Coomassie blue stained SDS/PAGE experiments show the time course of digestion by trypsin; (Right) protection by 1 mM glycine; lanes show a 31-kDa marker (MW), uncut protein (UC), and samples at the indicated times in minutes after addition of trypsin. (B) Titration of refolded ML032222a R703K by glycine analyzed by ITC, with raw (Top) and integrated (Bottom) data fit with a binding isotherm of Kd = 28 nM. (C) Titration of ML032222a E423S by glycine analyzed by ITC, with raw (Top) and integrated (Bottom) data fit with a binding isotherm of Kd = 2.5 µM.

