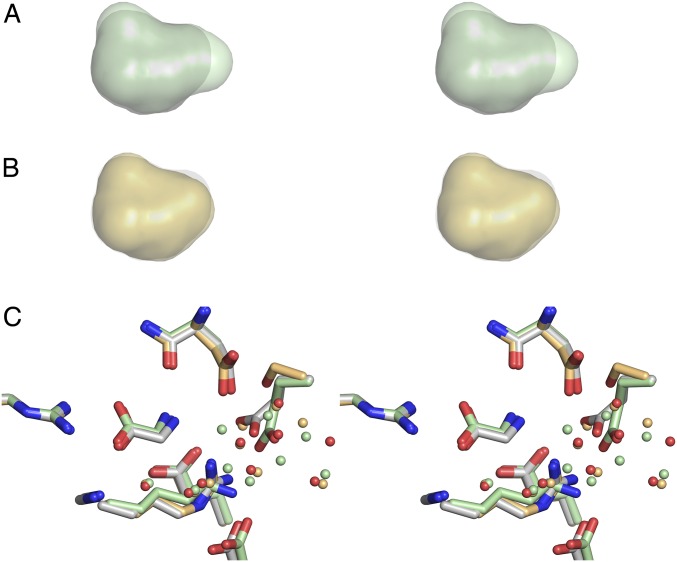
Fig. S1.
Comparison of LBD cavity sizes and water molecule networks in the WT, R703K, and E423S mutants. (A) Stereoview of a superposition of the LBD cavity for WT (gray) and R703K (pale green). (B) Stereoview of a superposition of the LBD cavity for WT (gray) and E423S (pale orange). (C) Stereoview of superpositions using domain 1 main chain coordinates for residues forming the glycine binding site, with carbon atoms and water molecules colored pale green for R703K and pale orange for E423S, respectively; for WT, carbon atoms are gray with water molecules colored red.

