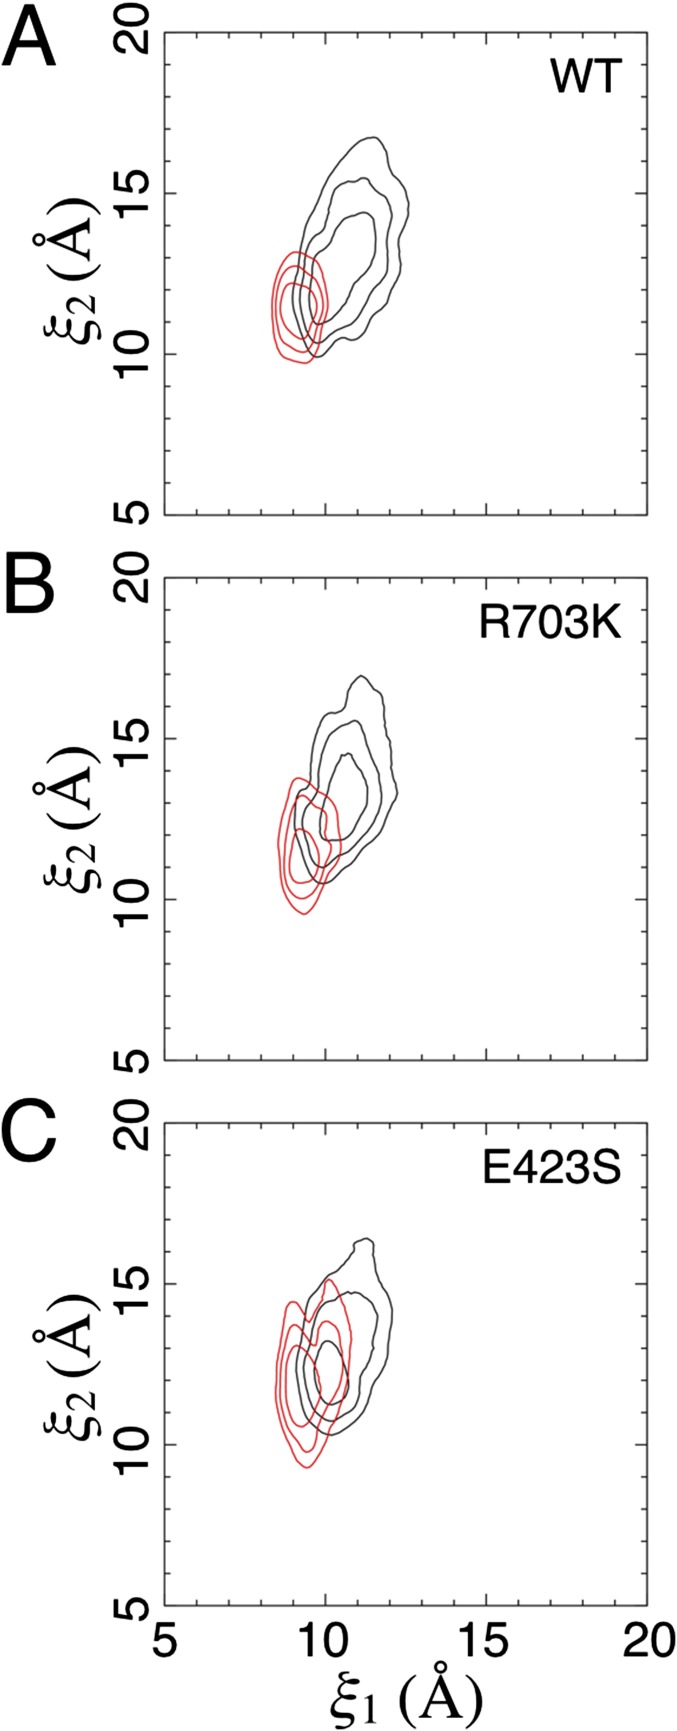
Fig. S2.
Comparison of free energy basins for the apo and glycine complex LBDs. (A) The lowest three contour lines from the 2D PMFs in Fig. 4 are shown for the WT LBD. Apo is shown in black, and the glycine complex is shown in red. (B) Contours for the R703K LBD. (C) Contours for the E423S LBD.

