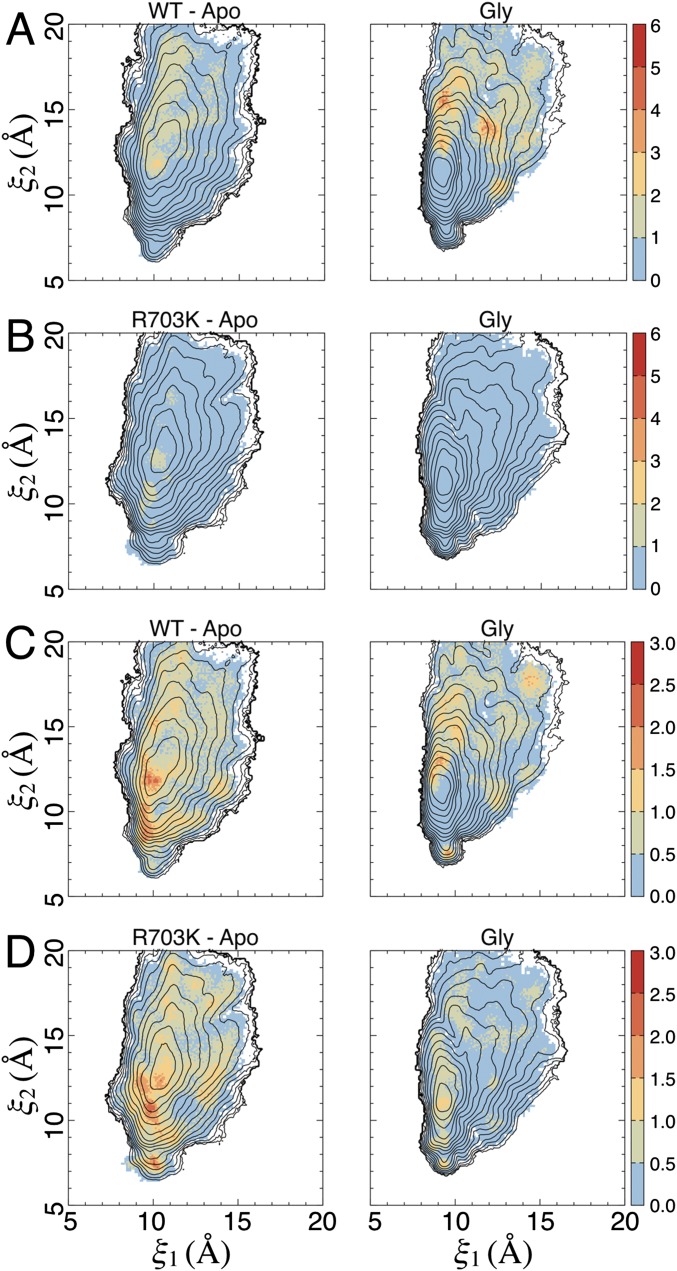
Fig. S4.
The SD of distance measurements involving the salt bridge residues (Fig. 5). (A) SD in Fig. 5A. (Left) The apo state. (Right) The glycine complex. SDs are shown in Ångstroms (see the color bars). The contour lines are taken from the 2D PMFs (Fig. 4). (B) SD in Fig. 5B. (C) SD in Fig. 5C. (D) SD in Fig. 5D.

