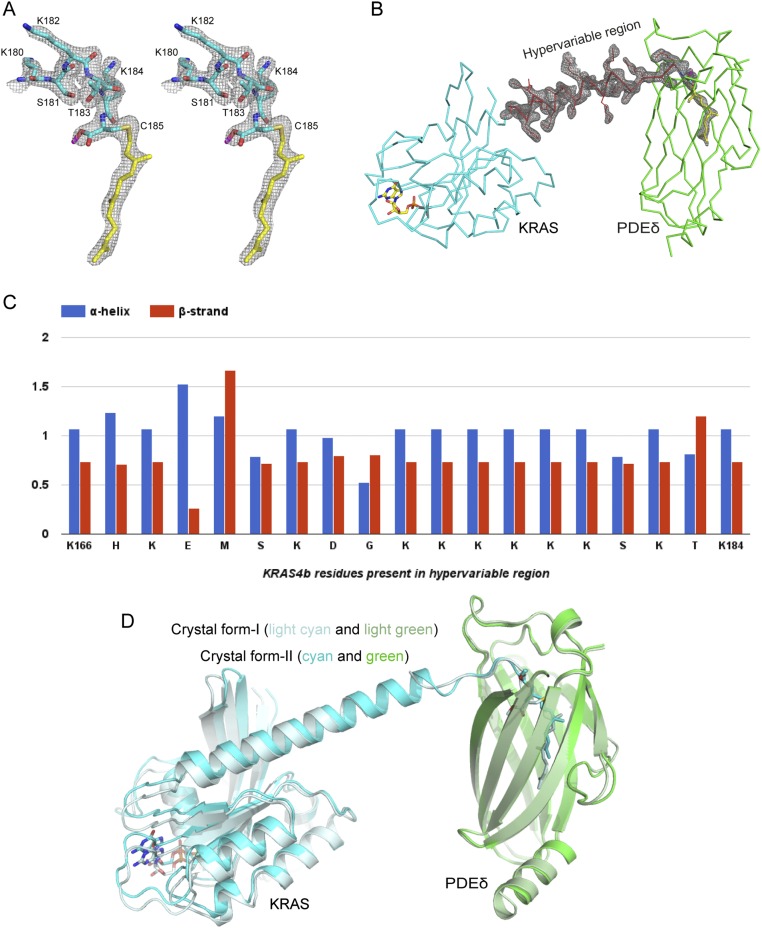
Fig. S2.
Electron density corresponding to the HVR residues, superposition of two crystal forms, and secondary structure propensity analysis of the HVR residues. (A) 2Fo-Fc map contoured at 1.0σ for the HVR residues interacting with PDEδ and farnesylated–methylated C185 in the KRAS4b–PDEδ complex in crystal form I. (B) 2Fo-Fc map contoured at 1.0σ for the HVR residues and farnesylated–methylated C185 in the KRAS4b–PDEδ complex in crystal form II. (C) Secondary structure propensity for residues present in the HVR of KRAS4b. (D) Structural superposition of two crystal forms of KRAS4b–PDEδ complexes aligned using residues of PDEδ. KRAS4b and PDEδ in crystal form I are colored light cyan and light green, respectively and in crystal form II, are colored cyan and green, respectively. Farnesylated–methylated C185 and GDP are shown in stick representation.

