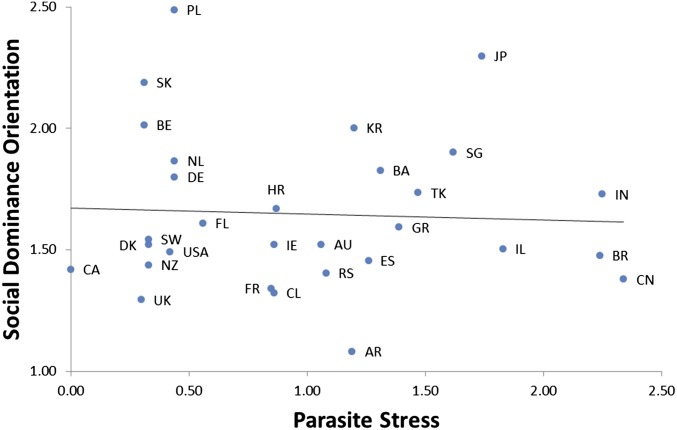
Fig. 2.
The scatterplot displays the relationship between national parasite stress and SDO (r = −0.06). Each data point [labeled with a two-letter country code (abbreviations defined in Table 1)] represents a nation's mean SDO, controlling for sample demographic characteristics (age and sex).

