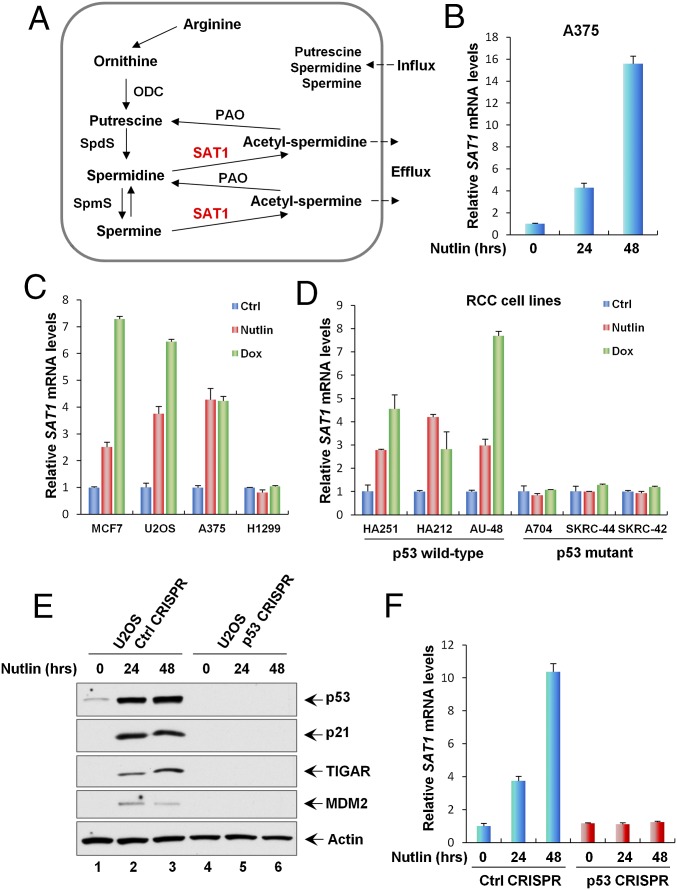
Fig. 1.
SAT1 is induced by p53. (A) The polyamine metabolism pathway. ODC, ornithine decarboxylase; PAO, N1-acetylpolyamine oxidase; SAT1, spermine/spermidine N1-acetyltransferase 1; SpdS, spermidine synthase; SpmS, spermine synthase. (B) qRT-PCR analysis of the SAT1 transcript level was performed with total RNAs purified from A375 cells treated with Nutlin (10 μM) for the indicated times. (C) qRT-PCR analysis of the mRNA expression levels of SAT1 in the indicated cancer cell lines (MCF7, U2OS, A375, and H1299) untreated (Ctrl) or treated with Nutlin (10 μM) or Dox (0.2 μg/mL) for 24 h. (D) The indicated RCC cell lines were untreated or treated with Nutlin (10 μM) or Dox (0.2 μg/mL) for 24 h, and SAT1 mRNA levels were measured using qRT-PCR. (E) U2OS control CRISPR and p53 CRISPR cell lines were treated with Nutlin (10 μM) for the indicated times, and total protein lysates were subjected to Western blotting analysis for the expression of p53, p21, TIGAR, MDM2, and Actin. (F) SAT1 transcript levels were measured by qRT-PCR in U2OS control CRISPR and p53 CRISPR cell lines treated with Nutlin (10 μM) for the indicated times. All mRNA expression levels were normalized with GAPDH. Error bars represent the SD from three experiments.

