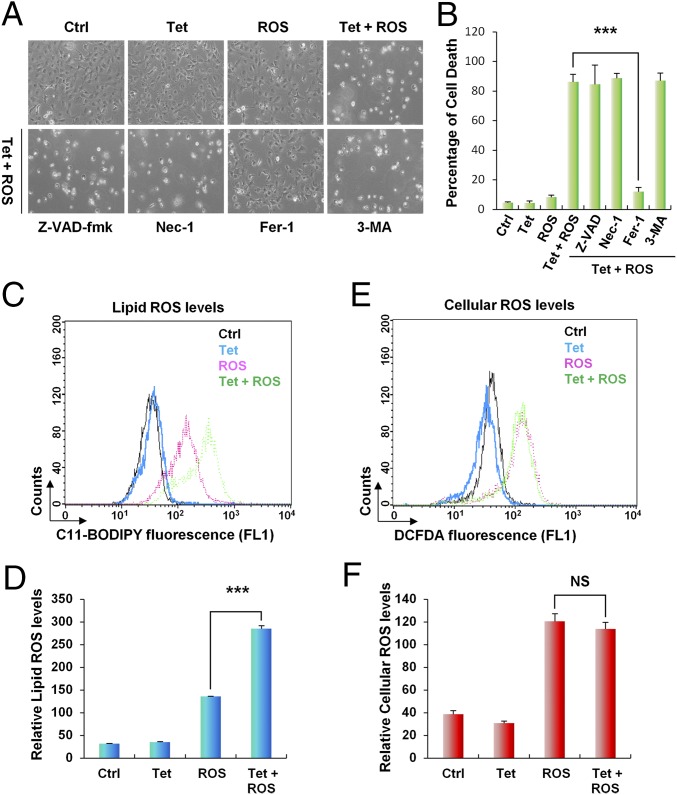
Fig. 4.
SAT1 overexpression leads to lipid peroxidation and ferroptosis upon ROS stress. (A) Representative phase-contrast images of SAT1 Tet-on cells treated with 0.5 μg/mL tetracycline and 60 μM TBH for 24 h. The images also show cells treated with tetracycline and TBH with the addition of specific cell-death inhibitors for 24 h: Z-VAD-fmk, a caspase inhibitor, 10 μg/mL; Necrostatin 1 (Nec-1), a necroptosis inhibitor, 10 μg/mL; Ferrostatin-1 (Fer-1), a ferroptosis inhibitor, 2 μM; and 3-methyladenine (3-MA), an autophagy inhibitor, 2 mM. (B) The percentages of cell death for all experiments shown in A were measured by trypan blue exclusion assay. (C and E) Lipid (C) and cytosolic (E) ROS production in SAT1 Tet-on cells treated with tetracycline and TBH for 24 h was assessed by flow cytometry using C11-BODIPY and H2DCFDA. (D and F) Quantification of lipid (D) and cytosolic (F) ROS levels from three representative experiments. Data are shown as mean ± SD. ***P < 0.001. NS, no significant difference.

