Significance
We describe an overarching organization of large-scale connectivity that situates the default-mode network at the opposite end of a spectrum from primary sensory and motor regions. This topography, based on the differentiation of connectivity patterns, is also embedded in the spatial distance along the cortical surface between these respective systems. In addition, this connectivity gradient accounts for the respective positions of canonical networks and captures a functional spectrum from perception and action to more abstract cognitive functions. These results suggest that the default-mode network consists of regions at the top of a representational hierarchy that describe the current cognitive landscape in the most abstract terms.
Keywords: topography, connectivity, cortical organization, default-mode network, gradients
Abstract
Understanding how the structure of cognition arises from the topographical organization of the cortex is a primary goal in neuroscience. Previous work has described local functional gradients extending from perceptual and motor regions to cortical areas representing more abstract functions, but an overarching framework for the association between structure and function is still lacking. Here, we show that the principal gradient revealed by the decomposition of connectivity data in humans and the macaque monkey is anchored by, at one end, regions serving primary sensory/motor functions and at the other end, transmodal regions that, in humans, are known as the default-mode network (DMN). These DMN regions exhibit the greatest geodesic distance along the cortical surface—and are precisely equidistant—from primary sensory/motor morphological landmarks. The principal gradient also provides an organizing spatial framework for multiple large-scale networks and characterizes a spectrum from unimodal to heteromodal activity in a functional metaanalysis. Together, these observations provide a characterization of the topographical organization of cortex and indicate that the role of the DMN in cognition might arise from its position at one extreme of a hierarchy, allowing it to process transmodal information that is unrelated to immediate sensory input.
A key assumption in neuroscience is that the topographical structure of the cerebral cortex provides an organizing principle that constrains its cognitive processes. Recent advances in the field of human connectomics have revealed multiple large-scale networks (1–3), each characterized by distinct functional profiles (4). Some are related to basic primary functions, such as movement or perceiving sounds and images; some serve well-documented, domain-general functions, such as attention or cognitive control (5–8); and some have functional characteristics that remain less well-understood, such as the default-mode network (DMN) (9, 10). Although the topography of these distinct distributed networks has been described using multiple methods (1–3), the reason for their particular spatial relationship and how this constrains their function remain unclear.
Advances in mapping local processing streams have revealed spatial gradients that support increasingly abstract levels of representation, often extending along adjacent cortical regions in a stepwise manner (11). In the visual domain, for example, the ventral occipitotemporal object stream transforms simple visual features, coded by neurons in primary visual cortex, into more complex visual descriptions of objects in anterior inferior temporal cortical regions and ultimately, contributes to multimodal semantic representations in the middle temporal cortex and the most anterior temporal cortex that capture the meaning of what we see, hear, and do (12–15). Similarly, in the prefrontal cortex, a rostral–caudal gradient has been proposed, whereby goals become increasingly abstract in anterior areas more distant from motor cortex, because they are increasingly removed from selection processes that operate on specific motor representations (5, 16–19). Much like the function–structure correspondence elucidated by topographic maps within sensory and motor areas (20, 21), these processing gradients provide a systematic mapping between spatial position and a functional spectrum of increasingly abstract representations (22).
Processing gradients have proven useful for understanding the relation between specific regions and function in separate domains: Mesulam (23) observed that the emergence of more abstract functional classes of cortex may follow a similar trajectory, hypothesizing that abstract categories emerge from the convergence of information across modalities (Fig. 1C). This notion has recently been extended by Buckner and Krienen (24), who proposed the “tethering hypothesis,” arguing that association cortex gains its functional attributes through its increasing spatial distance from the constraints that determine the functional specialization of primary cortex. These viewpoints suggest that there may be macroscale gradients that integrate information across multiple domains into progressively more abstract representations, in which local gradients within specific cortical systems could be situated and understood.
Fig. 1.
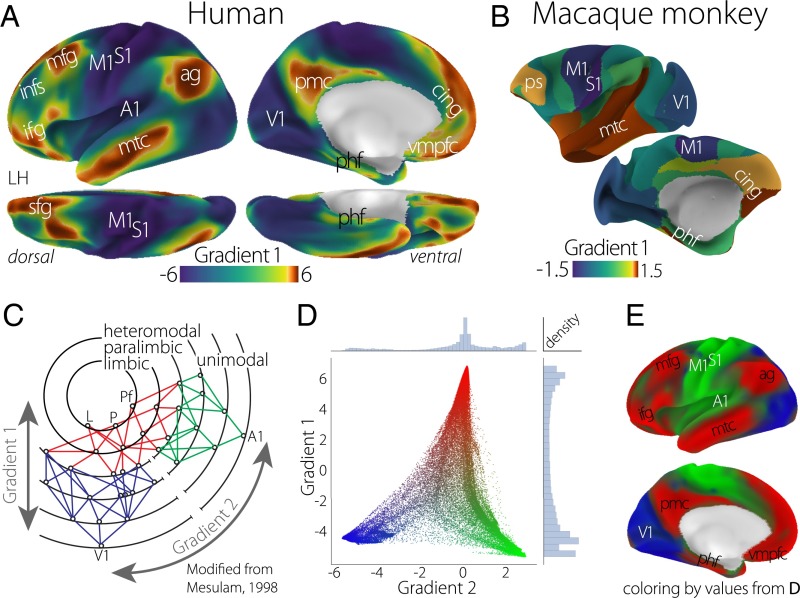
The principal gradient of connectivity in both the (A) human and (B) macaque monkey cortices shows a spectrum between unimodal regions (dark blue) and transmodal regions (sienna), which in the human cortex, peaks in regions corresponding to the DMN. The proximity of colors can be interpreted as greater similarity of connectivity patterns. (C) The illustration of connectivity organization suggested by Mesulam (23) proposes a hierarchy of processing from distinct unimodal areas to integrative transmodal areas. Labels Gradient 1 and Gradient 2, which were not included in the original figure, correspond to the results in D. Modified from ref. 23. (D) A scatter plot of the first two connectivity embedding gradients. Gradient 1 extends between primary sensorimotor and transmodal regions (red). Gradient 2 separates somatomotor and auditory cortex (green) from visual cortex (blue). Histograms depicting the distribution of values are presented on the respective axes. (E) Colors from the scatter plot are presented on the cortical surface for anatomical orientation. A1, primary auditory; ag, angular gyrus; cing, anterior cingulate cortex; ifg, inferior frontal gyrus; infs, intermediate frontal sulcus; L, limbic; M1, primary motor; mfg, middle frontal gyrus; mtc, middle temporal cortex; P, parietal; Pf, prefrontal; phf, parahippocampal formation; pmc, posteromedial cortex; ps, principal sulcus; S1, primary somatosensory; sfg, superior frontal gyrus; V1, primary visual; vmpfc, ventromedial prefrontal cortex.
One large-scale cortical system with function that remains unclear is the DMN. Initially identified through its tendency to deactivate during externally oriented tasks (25), the DMN has since been shown to activate in tasks that depend on information retrieved from memory, such as remembering the past or thinking about the future, or considering the mental states of others (reviews are in refs. 10 and 26). The DMN is also known to play a role in states that are less related to ongoing environmental events, such as daydreaming and mind wandering (27–30), and contributes to lapses in external processing (31). A consensus view on the role of the DMN in human cognition is still lacking, however, because of the increasing number of cognitive domains in which it has been implicated. As well as playing an active role during states, such as autobiographical memory retrieval, social cognition, and future thinking, the DMN has recently been shown to operate in concert with regions implicated in cognitive control during complex working memory tasks (32–36). This emerging evidence illustrates that the DMN is not tied to a specific form of informational content, leading to suggestions that it acts as a hub that integrates representational information across the cortex (30, 37).
To understand the topographic organization of the cerebral cortex at the macroscale (38), we explore how the principal variance in cortical connectivity relates to the topography of structure and function by addressing four key questions. (i) Is there a macroscale gradient of connectivity in the human brain that reflects the systematic integration across modalities in a hierarchical fashion? (ii) Does this macroscale organization relate to the geometric structure of the cortex? (iii) Does the organization captured by the principal gradient account for the spatial distribution of large-scale networks and the associated functions across the cortex? (iv) Do these observations provide a framework for understanding the functional role of the DMN in cognition?
Results
We began our analysis by characterizing the components describing the maximum variance in functional connectivity patterns—the extent to which nodes agree in the spatial distribution of correlations—across the human cerebral cortex (Fig. 1 and Fig. S1). The functional connectivity matrix consisted of 91,282 cortical and subcortical “grayordinates” with a resolution of 2 mm from the preprocessed dense connectome S900 release of the Human Connectome Project (HCP) (39). These data were based on 1 h of resting-state fMRI data acquired from 820 healthy adult individuals. No further processing of the connectivity matrices beyond those already implemented by the HCP, which included minimal spatial smoothing of 2 mm FWHM (40), was conducted.
Fig. S1.
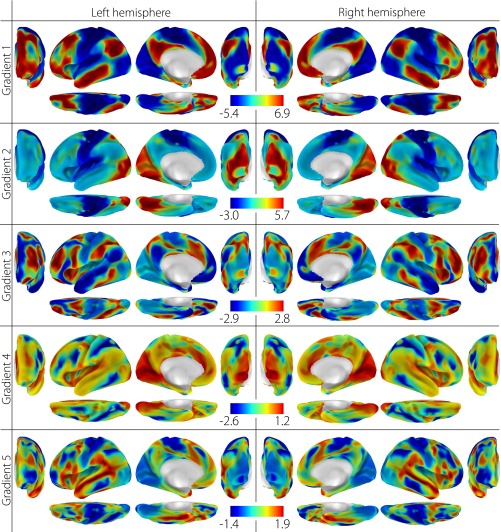
Human connectivity gradients 1–5. The first five components result from diffusion embedding of the human connectivity matrix. The first five are shown because of the drop in variance explained after the fifth component (Fig. S2).
Rather than delineating discrete network parcellations, we implemented a method that captures gradients in connectivity patterns over space—a cortical feature termed “connectopies” (41). This method, known as diffusion embedding (42), allows local and long distance connections to be projected into a common space more effectively than approaches that use linear dimensionality reduction, such as principal component analysis (SI Materials and Methods). The resultant components, which we describe here as “gradients,” are unitless and identify the position of nodes along the respective embedding axis that encodes the dominant differences in nodes’ connectivity patterns.
The Principal Gradient in Humans and Macaque Monkeys.
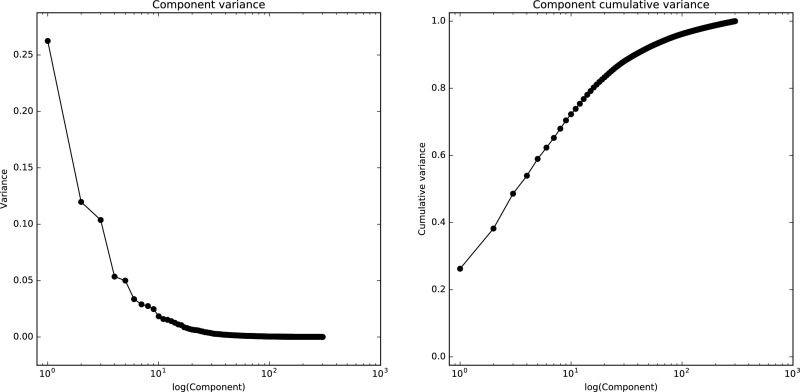
The principal gradient (Fig. 1A), which accounts for the greatest variance in connectivity in the human brain (Fig. S2), is anchored at one end by the primary and unimodal visual, somatosensory/motor, and auditory regions. At the other end are regions including the angular gyrus, rostral anterior cingulate, posteromedial cortex, middle temporal gyrus, and middle and superior frontal gyri—regions that, in humans, are collectively described as the DMN. Regions situated between the two extreme ends of the principal gradient include the inferior frontal sulcus, the intraparietal sulcus, and the inferior temporal sulcus, constituting heteromodal integration and higher-order cognitive regions.
Fig. S2.
The λ values of the diffusion embedding components in humans. The λ values of the first 300 components in the human connectivity data (Left) and cumulative λ values (Right). The gap after the first component indicates that the sorting of the principal gradient is stable.
The initial proposal of Mesulam (23) was motivated by tract-tracing studies conducted in the macaque monkey. To determine whether our method would generalize to these forms of data, we performed the same embedding analysis on a publicly available database of tract-tracing studies conducted in the macaque monkey. The principal gradient of the macaque monkey cerebral cortex is presented in Fig. 1B and similar to the human functional connectivity-based results, anchored at one end by visual and somatosensory/motor regions and at the other end by higher-order transmodal regions in the temporal lobe and the medial and lateral prefrontal cortexes. The cross-species correspondence of the principal gradient suggests that this axis of connectivity variation is phylogenetically conserved and may represent a primary dimension of cortical expansion (43).
The topography of the principal gradient in both the human and macaque monkey is consistent with the claim that cortical connectivity is organized along a dimension spanning primary/unimodal and transmodal regions—a hypothesis that is summarized schematically along the Gradient 1 dimension in Fig. 1C. However, for this spectrum to indicate hierarchical integration across distinct modalities, the following connectivity component should distinguish between primary modalities as indicated by the dimension Gradient 2 in Fig. 1C.
Consistent with the hypothesis by Mesulam (23) (Fig. 1C), the component accounting for the second-most variance in connectivity in the human brain differentiates regions solely within the unimodal end of the principal gradient (Fig. 1D). One end of the spectrum is characterized by regions of the occipital cortex implicated in processing visual input, whereas the opposite end includes the somatosensory and motor regions surrounding the central sulcus as well as the auditory regions of the temporal perisylvian region (Fig. 1E). The convergence described by the first two connectivity gradients across sensory/motor modalities and toward a singular set of nodes within transmodal cortex is consistent with the claim that the principal gradient is organized along a dimension that integrates unimodal regions in a hierarchical manner (Fig. 1C). Moreover, the principal gradient, anchored at one end by the DMN, contains within it several local processing gradients that have already been described within the temporal and frontal lobes (12–15, 17–19). Additional gradients describing progressively less connectivity variance are available in Fig. S1.
DMN Peaks of the Principal Gradient Are Equidistant from Primary Areas.
Having characterized the topography of a principal gradient in connectivity, we next investigated whether it is related to the intrinsic geometry of the cortex. To do so, we examined whether regions at the extreme of the DMN end occupy spatial locations that are maximally distant along the cortical surface from unimodal regions. We selected seven peak cortical nodes across the DMN clusters of the principal gradient and calculated the minimum geodesic distance from all other nodes to any of these “seed” nodes (additional description of methods is in SI Materials and Methods).
Fig. 2 shows that cortical distance reproduces many features of the spatial embedding of the principal gradient. Four of the peak DMN nodes are equidistant from the central sulcus, which is the topographical landmark of primary somatosensory/motor cortex. Likewise, we observe a similar correspondence with the calcarine sulcus, marking the location of primary visual cortex. More generally, distance clearly increases with lower principal gradient values, with an especially rapid transition in the connectivity gradient between 25 and 40 mm and plateaus at the extremes (Fig. 2B). This relationship is, nevertheless, captured by a linear fit ( = 0.55). It is noteworthy that unimodal regions are at least 40 mm from the DMN peaks. In similar analyses of macaque monkey cortical distance (Fig. S3), we observed a comparable distance threshold for unimodal regions. In sum, this analysis shows that the principal connectivity gradient reflects macrostructural features of cortical organization: the nodes corresponding to one extreme end of the gradient—core regions of the DMN—are maximally distant from regions that directly govern perception and action.
Fig. 2.
(A) The minimum geodesic distance (in millimeters) from each point on the cortical surface to seven seed nodes located in the positive peaks of the principal gradient. Morphological landmarks of primary areas denoted by white dotted lines, such as the central sulcus (cs; somatosensory/motor), calcarine sulcus (cals; visual), and transverse temporal gyrus (tt; auditory), are equidistant from the surrounding DMN peaks (illustrated by arrows). Gray lines mark the calculated equidistant line. (B) The contour scatter plot shows the negative relationship between geodesic distance from seven positive peak locations and the principal gradient ( = 0.55).
Fig. S3.
Geodesic distance along the macaque monkey cortical surface from transmodal peak areas. The minimum geodesic distance along the cortical surface (Left) from the top five regions of the principal gradient (Center) (Fig. 1B). The scatter plot (Right) depicts the average geodesic within each region with respect to the principal gradient. Cortical areas are labeled using the Bonin–Bailey parcellation (77, 78).
The Principal Gradient Captures the Spatial Layout of Large-Scale Networks.
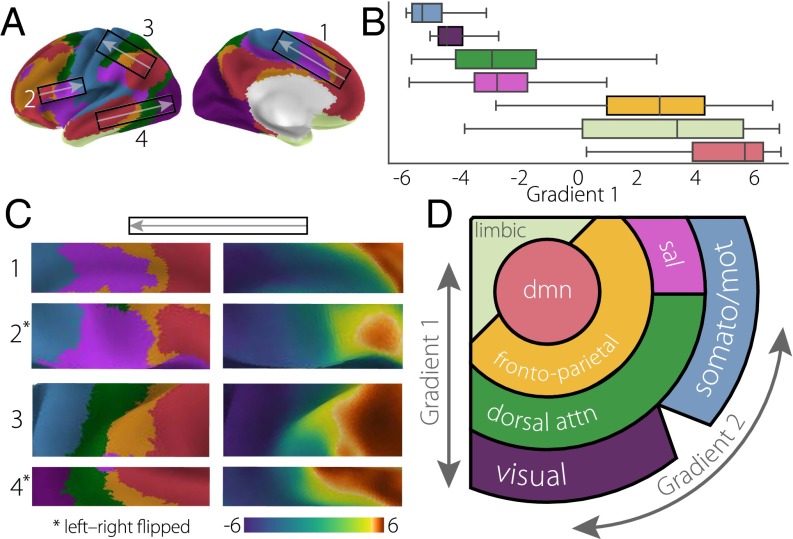
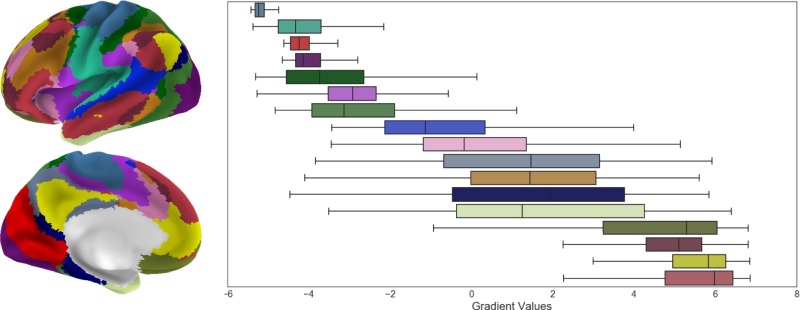
We next examined the extent to which the principal gradient captures the macroscale layout of intrinsic functional connectivity networks. Despite the high reproducibility of large-scale resting-state networks (1, 44–46), there is no clear overarching spatial schema to explain the transition of one network to another. We examined the widely used seven-network parcellation by Yeo et al. (2) with respect to the position of each network along the principal gradient (Fig. 3A). [Results using the 17-network parcellation from ref. 2 are presented in Fig. S4.]
Fig. 3.
(A) The principal gradient values from each of seven networks (2) are presented as (B) box plots ordered by the mean value. (C) Illustrative cutouts taken from A to show the repeated patterns of network spatial adjacency captured by the principal gradient. Arrows in A indicate the corresponding orientation of the cutouts. (D) A schematic of the spatial relationships of canonical resting-state networks (2) applying the schema suggested in ref. 23 presented in Fig. 1C. dmn, default-mode network; dorsal attn, dorsal attention network; sal, salience network; somato/mot, somatosensory/motor network.
Fig. S4.
Distribution of the principal gradient across 17-network parcellation from ref. 2. Each boxplot presents the principal gradient values within the respective network of interest. The network parcellation includes the 17 networks from ref. 2.
Fig. 3 shows that networks are not randomly distributed along this dimension: instead, as shown in the box plots in Fig. 3B, cortical nodes from the same network tend to cluster at similar positions. Importantly, the DMN identified in this parcellation (Fig. 3, red) occupies one extreme position along the principal gradient and is maximally separated from visual (Fig. 3, purple) and motor (Fig. 3, blue) networks, which are at the other extreme. One exception is the limbic network (Fig. 3, beige), which includes an extensive range of values. However, the spatial distribution of this network may be accounted for by low signal to noise within the original data used for parcellation (2), and it may, thus, not accurately reflect the connectivity of its constituent regions.
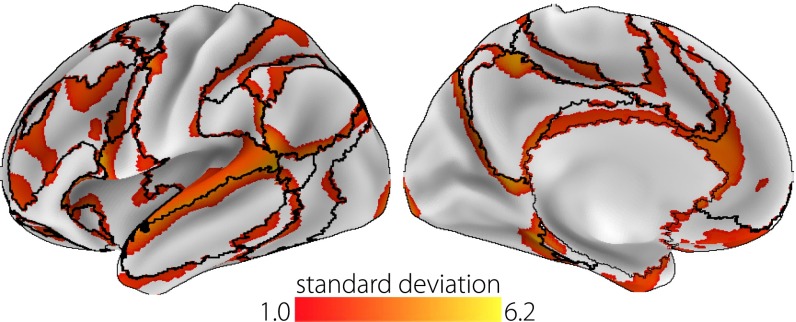
This analysis, therefore, shows that the principal gradient of connectivity provides a framework for the spatial ordering of large-scale networks. In addition, the principal gradient captures similar, repeating transitions between these networks, which occur across cortical lobes (Fig. 3C). We represent this consistent arrangement as a schematic illustration in Fig. 3D. Notably, outlier gradient values for each network are located predominantly at their boundaries (Fig. S5), suggesting that, in some cases, the principal gradient describes gradual connectivity transitions that are obscured by discrete network parcellation.
Fig. S5.
Principal gradient outliers are proximate to the boundaries between networks. The standard deviation (SD) values of principal gradient values are calculated for each node with respect to other values within the same network [seven networks (2)]. SD values greater than 1.0 are presented. Outliers predominantly neighbor the network boundaries (black lines), indicating that the principal gradient captures gradual transitions between network-level connectivity patterns.
Distribution of Functions Along the Principal Gradient.
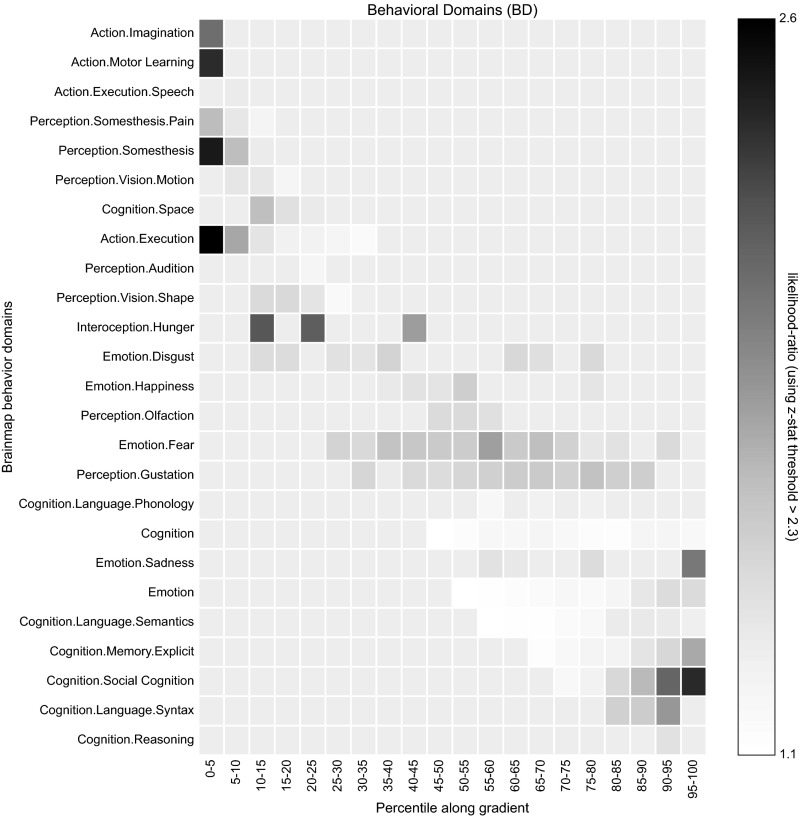
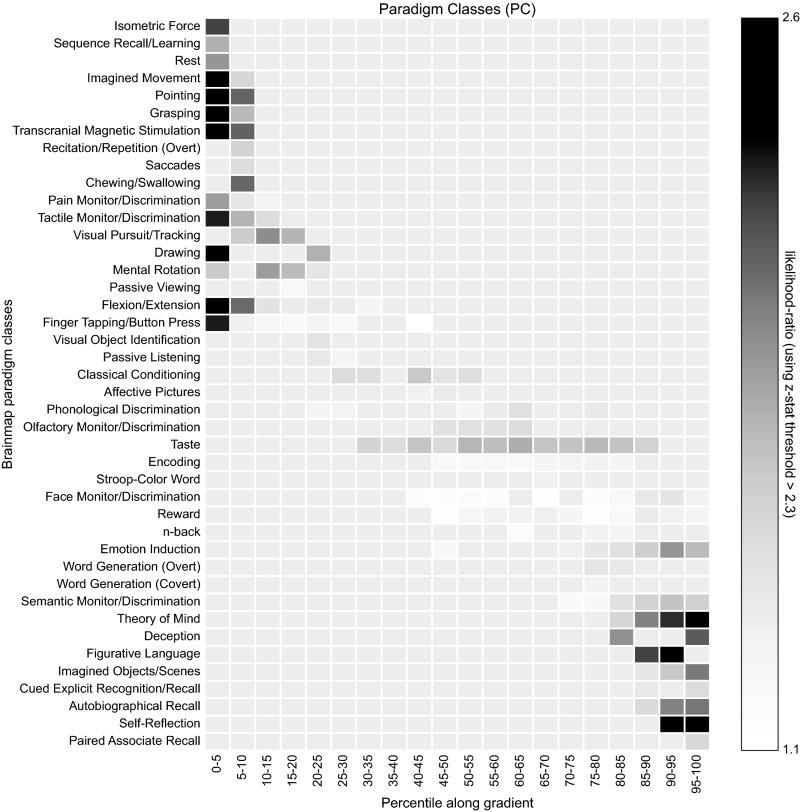
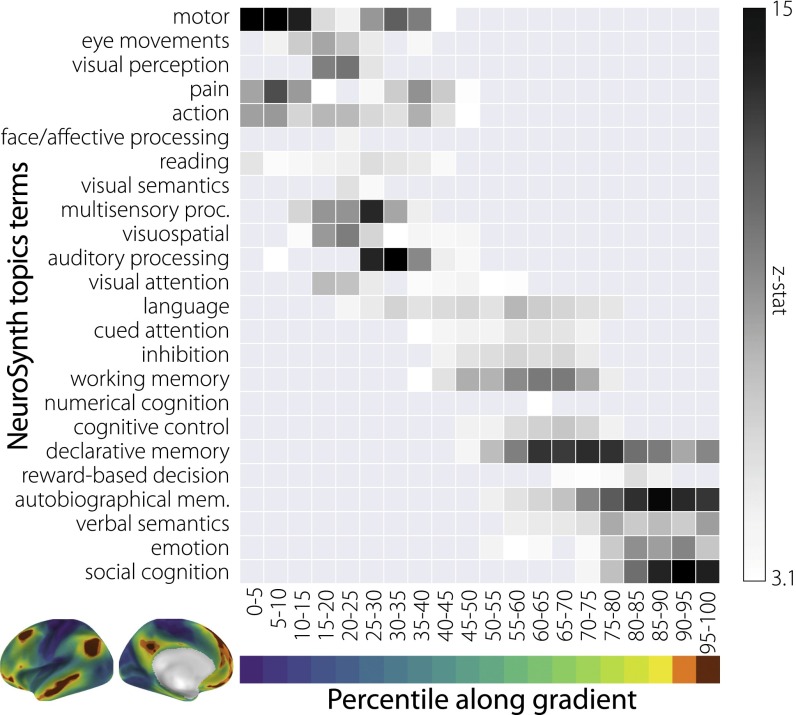
Our final analysis explored whether the regions located at the DMN extreme of the gradient serve functions that are abstracted from perception and action. We conducted a metaanalysis using the NeuroSynth database (47) [Figs. S6 and S7 show corresponding analysis using the BrainMap database (48)] and examined the association between a list of topic terms with regions of interest created from five-percentile bins of the principal gradient. Topic terms were sorted by their weighted average position along the gradient, revealing a systematic shift in function. Fig. 4 shows that the unimodal end is characterized by terms depicting acting and perceiving, such as “motor,” “visual perception,” “multisensory processing,” and “auditory processing,” whereas the end characterized by the DMN emphasizes terms such as “social cognition,” “verbal semantics,” and “autobiographical memory”—tasks that rely on complex representations abstracted away from specific sensory and motor processes. Between the extremes, we observe domain-general functions, such as “cued attention,” “inhibition,” and “working memory,” in regions corresponding to the dorsal attention and salience networks above (Fig. 3D).
Fig. S6.
BrainMap behavioral domains. Metaanalysis of the BrainMap behavioral domains with respect to the principal gradient.
Fig. S7.
BrainMap paradigm classes. Metaanalysis of the BrainMap paradigm classes with respect to the principal gradient.
Fig. 4.
NeuroSynth metaanalysis of regions of interest along the principal gradient using 24 topic terms. Terms are ordered by the weighted mean of their location along the gradient. Sensory processing terms are located at the top followed by domain-general cognitive functions and then, higher-order abstract cognitive and memory-related processes. Similar results using the BrainMap database are available in SI Materials and Methods. autobiographical mem., autobiographical memory; multisensory proc., multisensory processing.
SI Materials and Methods
Connectivity Data.
Connectivity data for the human and macaque monkey brains were assembled from openly available sources. Because acquisition procedures and the method for assessing connectivity varied between species, the first step was to transform each species’ dataset into an affinity matrix describing the pairwise similarity of connectivity values.
Human.
The connectivity matrix for the human brain was based on 1 h of resting-state fMRI data acquired through the HCP (39) and made publicly available for download on ConnectomeDB (71). In brief, for each individual, a functional connectivity matrix was calculated using the correlation coefficient across four minimally preprocessed (40, 72–74), spatially normalized, and concatenated 15-min resting-state fMRI scans. We began with the group-averaged functional connectivity data, which include 820 individuals coregistered using MSMAll. More information about this dataset can be found at www.humanconnectome.org/documentation/S900/820_Group-average_rfMRI_Connectivity_December2015.pdf. The “dense” functional connectome matrix consists of pairwise z-transformed correlation values between all grayordinates (91,282 rows). Cortical data are represented in HCP 32k_LR surface space (75), consisting of 32,492 total nodes per hemisphere (59,412 excluding the medial wall). Subcortical structures are represented in volumetric space and included 31,870 voxels.
We began by transforming the z to r correlation values with a hyperbolic tangent function, which scales them between −1 and 1. For each row in the matrix, the values of the top 10% of connections were retained, whereas all others were zeroed. Remaining connections were almost all positive, except for ∼5,000 (less than % of all connections) with negative values from 23 voxels. The voxels with negative connections were all located in ventral subcortical regions. These connection were zeroed as well. Because this procedure rendered the connectivity matrix A asymmetric, similarity between all pairs of rows was calculated using cosine distance, resulting in the positive, symmetric affinity matrix L. The full affinity matrix, L, consisted of weights between zero and one, representing similarity of connectivity profiles among over 4 billion node pairs.
Macaque Monkey.
Macaque monkey connectivity data were derived from the axonal tract-tracing connectivity database CoCoMac (67, 68) and presented in the F99 template space (76) using cortical area labels based on the Bonin–Bailey parcellation (77, 78). One cortical area was removed, because it displayed no connectivity with other areas, leaving 25 areas remaining. The 25 × 25 connectivity matrix initially consists of sources (rows) and targets (columns), where edges were values between one (weak) and three (strong) connections. Of the possible edges, 56% were present in the connectivity matrix. To create a similarity matrix that accounted for bidirectional connectivity, the connectivity matrix, A, was transposed and concatenated with the initial matrix: . A was then transformed into a positive, symmetric affinity matrix L by calculating the Euclidean distance between each pair of rows.
Connectivity Embedding.
We used diffusion embedding (42), a nonlinear dimensionality reduction technique, to recover a low-dimensional embedding from high-dimensional connectivity data. Connectivity data include both local and long-range connections. Diffusion maps translate these relationships into distances and represent the global connectivity structure as a distribution of cortical points in an embedding space. Cortical points that are strongly connected by either many connections or few very strong connections are close in this space, whereas points without connections are far apart. Linear techniques, such as principal component analysis, are unable to project such data without appropriate kernel manipulations. Among the numerous nonlinear dimensionality reduction algorithms currently in use, we chose diffusion map embedding (42), because the diffusion process limits the distances of influence to the graph neighborhood, thereby ensuring a stable representation of connections, regardless of the graph size (79). Other similar approaches have been previously applied to whole-brain structural connectivity data (80, 81).
Diffusion maps are a one-parameter (α) family of graph Laplacians that integrate local information into a global description. A diffusion map embedding reduces high-dimensional data to a low-dimensional representation that combines geometry with probability distribution of data points. Using an appropriately normalized random walk process, the parameter, α, can control whether the low-dimensional embedding reflects the geometry of the set, regardless of density of points or the long-time dynamics of the samples without uniform sampling. In other words, the parameter α controls the influence of density of sampling points on the underlying manifold (α = 0, maximal influence of sampling density; α = 1, no influence of sampling density). Their relationship to other embedding methods based on graph Laplacians is detailed in ref. 82.
Diffusion maps, which use an α of 0.5, are well-suited for the analysis of brain connectivity data for multiple reasons. First, they retain the global relations between data points in the embedded space. Second, they are more robust to noise in the connectivity matrix, unlike other techniques, such as Isomap (83). Third, by using the appropriate choice of α, they can be made less sensitive to the distribution of data. Fourth, decreasing eigenvalues reflect a natural ordering of the diffusion process; the largest eigenvalues correspond to the slowest processes and thereby, represent the slowest variance in connectivity patterns. Fifth, by relying on local distances, they address the curse of dimensionality, because smaller distances are more meaningful than larger distances as the number of dimensions increases.
Technically, following ref. 42, the species-specific connectivity matrices (represented as ) described previously can be transformed to define a Markov chain with transition matrix . The eigenvectors of this transition matrix define an embedding that results in a representation of each vertex or region as a point in the embedding space. The mutual Euclidean distances between these representations reflect how closely connected the corresponding vertices are in the graph with regard to the diffusion process defined by the transition matrix. See algorithm 1 for pseudocode. Increasing the diffusion time (t) allows examination of the intrinsic geometric structure of the data at larger and larger scales, allowing a balance between details in the input data and the scale of assessment (79). In this implementation, we used an automated estimation of the diffusion time using a damped regularization process. In this approach, the eigenvalues are divided by to provide robustness against small, noisy eigenvalues. Such diffusion map embedding has been previously applied to functional task and resting MRI data (84–89). The source code for this method is available at https://github.com/satra/mapalign.
Geodesic Distance Along the Cortical Surface.
Geodesic distance along the cortical surface was calculated using an algorithm that approximates the exact distance along the shortest path between two nodes on a triangular surface mesh (69, 70). Seed nodes were selected from seven peak nodes from the principal gradient located within clusters corresponding to independent regions of the DMN (Fig. 2). A distance value was then assigned to each cortical node based on the minimum geodesic distance along the “midthickness” surface to any of the seed nodes. Results were then visualized on the “very_inflated” surface to enable visibility within sulci. Additional results for macaque monkey are available in Fig. S3.
The advantage of using exact geodesic distance rather than the more common and less computationally expensive Dijkstra’s algorithm is that the exact calculation returns a distance value that is independent of the mesh density. In addition, to ensure that the shortest paths would only pass through cortex, nodes representing the medial wall were removed from the triangular mesh during the geodesic distance calculation as implemented here: https://github.com/NeuroanatomyAndConnectivity/surfdist.
Ordering of Canonical Intrinsic Connectivity Networks.
For each network of the seven-network parcellation (2), we extracted the principal gradient values and sorted them by the mean (Fig. 3A). Additional analysis conducted on the 17-network parcellation (2) is presented in Fig. S4.
Metaanalytic Functional Gradients.
We used the NeuroSynth metaanalytic database (www.neurosynth.org) (47) to assess topic terms associated with the principal connectivity gradient. Regions of interest masks were created by projecting the cortical surface principal gradient map to the 2-mm volumetric MNI152 standard space (available at neurovault.org/images/24346/). The volumetric map was then binned into five-percentile increments and binarized. Each of these 20 maps ranging from 0–5% to 95–100% were used as inputs to the metaanalysis. For each region of interest map, the output of the analysis was a z statistic associated with the feature term. The terms were then ordered based on the weighted mean for visualization.
NeuroSynth.
Feature terms were derived from the 50 set of topic terms (v3) available at https://github.com/NeuroanatomyAndConnectivity/gradient_analysis/blob/master/gradient_data/neurosynth/v3-topics-50-keys.txt. Of the 50, 30 were above the threshold of , and 6 were removed as “noise” terms, because they did not capture any coherent cognitive function, leaving 24 topic terms (presented in Fig. 4).
BrainMap.
Functional characterization of the delineated zones was performed by reference to the BrainMap database [www.brainmap.org (90)]. We limited our analysis to functional neuroimaging studies in the healthy human brain (i.e., without interventions and without group comparisons), which reported results as coordinates in stereotaxic standard space. These inclusion criteria yielded 8,400 eligible experiments at the time of analysis. The functional characterization of each zone was then based on the behavioral domain (BD) and paradigm class (PC) metadata of those experiments that featured activation within each distance zone. That is, we first identified all experiments in BrainMap that activate a given zone and then, analyzed the BD and PC metadata of these experiments. BDs code the mental processes isolated by the statistical contrasts (91) and comprise the main categories cognition, action, perception, emotion, and interception as well as their related subcategories. PCs categorize the specific task used (www.brainmap.org/scribe/ has the complete BrainMap taxonomy). Only BDs/PCs for which more than 24 individual experiments were stored in the database were considered further.
The association between each BD/PC and a given distance zone was expressed as the likelihood ratio between the probability of finding this zone activated given a particular BD/PC label relative to the a priori chance (across the entire database) of finding activation in that particular cluster (56, 92). That is, we tested whether the conditional probability of activation given a particular label was higher than the baseline probability of activating the region in question per se . We then only retained significant associations as established using a binomial test ().
| Algorithm 1: Pseudocode for diffusion map embedding of a connectivity matrix representing similarity |
| Require: is a symmetric, similarity matrix with , diffusion time , and number of components () |
| {where recovers long-term dynamics} |
| {where } |
| For to N do |
| If , then |
| else |
| end if |
| end for |
| return = 0 |
Discussion
Our analysis characterized a principal gradient of cortical organization in the human connectome, which is anchored at one end by systems implicated in perceiving and acting, and at the other end by transmodal association regions, corresponding in humans to the DMN (Fig. 1). A comparative analysis using tract-tracing data from studies in the macaque monkey found a corresponding gradient, providing initial evidence that this axis of connectivity variation may be phylogenetically conserved. The observation that the principal gradient corresponds to the intrinsic geometry of the cortex—regions in the DMN have the greatest geodesic distance along the cortical surface from primary sensory/motor areas—further indicates this axis may provide a crucial blueprint for cortical organization (Fig. 2). We also found that large-scale networks are arranged along this axis, with the same transitions between consistently adjacent networks occurring throughout the cortex (Fig. 3). Finally, a task-based metaanalysis characterizing the functional attributes of this gradient showed a spectrum of increasing abstraction that follows the transition from unimodal cortex to the extreme end of the gradient in the DMN (Fig. 4).
The location of the DMN at one extreme end of the principal gradient provides an organizing principle for understanding its role in cognition. First, these findings provide anatomical support for why the DMN has been associated with processes that are unrelated to immediate stimulus input, such as daydreaming or mind wandering (27, 28, 30). The DMN is at a maximal distance from systems involved in perception and action in both functional connectivity and anatomical space, indicating that the neural activity in these regions is likely to be comparably insulated from direct environmental input (49, 50). Second, the location of the DMN as equidistant from all sensory/motor systems is aligned with its broad range of functions that requires integration between multiple sensory systems, including episodic (51) and semantic memory (52–54), social cognition (55, 56), goal-directed working memory tasks (26, 32, 33, 35), and reward-guided decision making (57, 58). The two cardinal features of the DMN related to abstraction––stimulus independence and content heterogeneity––can be accounted for by its position at the end of a topographical hierarchy that is equidistant from unimodal systems, thus acting as a hub of integration across multiple sensory modalities (37) (Fig. 3D).
The principal gradient illustrates a broader topographic organization of large-scale connectivity (38) that accounts for the spatial arrangement of local processing streams throughout the cerebral cortex. Gradients in both the temporal and prefrontal cortexes are apparent in Fig. 1, showing that these hierarchies are not isolated local phenomena; they emerge as elements of a spectrum that begins within input–output systems and ends with the DMN. Notably, our results are consistent with a recent modification of the rostral–caudal processing gradient described within lateral frontal cortex (59, 60). Rather than the more rostral areas located farther along in the processing hierarchy (18, 19), two distinct hierarchical gradients of temporal- and feature-related abstraction converge in middle lateral prefrontal cortex (60). The consistency between the principal gradient and this revised lateral prefrontal hierarchy suggests that it may provide a source for future studies investigating the detailed topography of local processing streams.
In addition to incorporating local processing streams within a global framework, the principal gradient situates discrete large-scale connectivity networks along a continuous spectrum. With recent advances in multimodal cortical parcellation (61), this approach provides a complementary means to describe the gestalt of the cortical mosaic. Future studies are needed to better characterize the types of transitions between different patterns of large-scale connectivity and identify where processing occurs in a stepwise (11) or “gradiential” manner (22).
It is now widely accepted that the DMN is important, because it permits cognitive processing that is independent of the here and now. This capacity is adaptive, because it permits flexibility: more abstract representations of a stimulus enable the generation of alternative behaviors, allowing original and creative thoughts to emerge (62). Along those lines, a “positive–negative” axis of brain–behavior covariation describes a similar connectivity spectrum, distinguishing the DMN from sensory/motor regions (63). Beyond supporting states of creativity and planning (64, 65), the DMN has also been implicated in almost all psychiatric conditions (66), indicating that there may be costs as well as benefits from the capacity to apprehend the world as it might be rather than seeing it as it is right now.
Materials and Methods
The principal gradient was derived from human (39) and macaque (67, 68) connectivity matrices using diffusion embedding (42)—a nonlinear dimensionality reduction technique (Fig. 1). Geodesic distance along the cortical surface from peak nodes of the transmodal end of the principal gradient, presented in Fig. 2, was calculated using an exact distance algorithm (69, 70). For the comparison with canonical large-scale networks (Fig. 3), the principal gradient values were extracted from each of seven networks from ref. 2. Finally, binarized masks at five-percentile increments of the principal gradient were used as regions of interest in a NeuroSynth (47) metaanalysis (Fig. 4). Additional information regarding methods is available in SI Materials and Methods as well as Figs. S1–S7. All software used in this study is openly available at https://neuroanatomyandconnectivity.github.io/gradient_analysis/.
All MRI data used in this study were publicly available and anonymized. Participant recruitment procedures and informed consent forms, including consent to share deidentified data, were previously approved by the Washington University Institutional Review Board as part of the HCP (39).
Acknowledgments
Data were provided by the HCP, and the Washington University, University of Minnesota, and Oxford University Consortium (Principal Investigators David Van Essen and Kamil Ugurbil; Grant 1U54MH091657) funded by 16 NIH Institutes and Centers that support the NIH Blueprint for Neuroscience Research, and the McDonnell Center for Systems Neuroscience at Washington University. S.S.G. was partially supported by NIH Grants 1R01EB020740-01A1, 1P41EB019936-01A1, 3R01MH092380-04S2, and 1U01MH108168-01. M.P. was supported by Canadian Institutes of Health Research Foundation Grant FDN-143212. E.J. was supported by Biotechnology and Biological Sciences Research Council (BB/J006963/1) and European Research Council Grant 283530-SEMBIND. J.S. was supported by European Research Council Grant WANDERINGMINDS–646927 and a grant from the John Templeton Foundation “Prospective Psychology Stage 2: A Research Competition” (to Martin Seligman). G.L. is supported by NIH National Institute of Biomedical Imaging and Bioengineering Neuroimaging Analysis Center P41EB015902; NIH National Institute of Neurological Disorders and Stroke R01NS086905; and Austrian Science Fund [Fonds zur Förderung wissenschaftlicher Forschung (FWF)] I2714-B31, KLI 544-B27, and Jubiläumsfonds der Österreichischen Nationalbank 15356. S.B.E. is supported by the National Institute of Mental Health (R01-MH074457), the Helmholtz Portfolio Theme “Supercomputing and Modeling for the Human Brain,” and the European Union Seventh Framework Programme (FP7/2007-2013) under Grant Agreement 604102. The opinions expressed in this publication are those of the authors and do not necessarily reflect the views of the John Templeton Foundation.
Footnotes
The authors declare no conflict of interest.
This article is a PNAS Direct Submission.
This article contains supporting information online at www.pnas.org/lookup/suppl/doi:10.1073/pnas.1608282113/-/DCSupplemental.
References
- 1.Damoiseaux JS, et al. Consistent resting-state networks across healthy subjects. Proc Natl Acad Sci USA. 2006;103(37):13848–13853. doi: 10.1073/pnas.0601417103. [DOI] [PMC free article] [PubMed] [Google Scholar]
- 2.Yeo BTT, et al. The organization of the human cerebral cortex estimated by intrinsic functional connectivity. J Neurophysiol. 2011;106(3):1125–1165. doi: 10.1152/jn.00338.2011. [DOI] [PMC free article] [PubMed] [Google Scholar]
- 3.Power JD, et al. Functional network organization of the human brain. Neuron. 2011;72(4):665–678. doi: 10.1016/j.neuron.2011.09.006. [DOI] [PMC free article] [PubMed] [Google Scholar]
- 4.Smith SM, et al. Correspondence of the brain’s functional architecture during activation and rest. Proc Natl Acad Sci USA. 2009;106(31):13040–13045. doi: 10.1073/pnas.0905267106. [DOI] [PMC free article] [PubMed] [Google Scholar]
- 5.Petrides M. Lateral prefrontal cortex: Architectonic and functional organization. Philos Trans R Soc Lond B Biol Sci. 2005;360(1456):781–795. doi: 10.1098/rstb.2005.1631. [DOI] [PMC free article] [PubMed] [Google Scholar]
- 6.Duncan J. The multiple-demand (md) system of the primate brain: Mental programs for intelligent behaviour. Trends Cogn Sci. 2010;14(4):172–179. doi: 10.1016/j.tics.2010.01.004. [DOI] [PubMed] [Google Scholar]
- 7.Cole MW, Yarkoni T, Repovs G, Anticevic A, Braver TS. Global connectivity of prefrontal cortex predicts cognitive control and intelligence. J Neurosci. 2012;32(26):8988–8999. doi: 10.1523/JNEUROSCI.0536-12.2012. [DOI] [PMC free article] [PubMed] [Google Scholar]
- 8.Petrides M. Lateral and dorsomedial prefrontal cortex and the control of cognition. In: Toga AW, editor. Brain Mapping: An Encyclopedic Reference, Volume 2: Anatomy and Physiology, Systems. Academic; London: 2015. pp. 417–422. [Google Scholar]
- 9.Greicius MD, Krasnow B, Reiss AL, Menon V. Functional connectivity in the resting brain: A network analysis of the default mode hypothesis. Proc Natl Acad Sci USA. 2003;100(1):253–258. doi: 10.1073/pnas.0135058100. [DOI] [PMC free article] [PubMed] [Google Scholar]
- 10.Raichle ME. The brain’s default mode network. Annu Rev Neurosci. 2015;38:433–447. doi: 10.1146/annurev-neuro-071013-014030. [DOI] [PubMed] [Google Scholar]
- 11.Sepulcre J, Sabuncu MR, Yeo TB, Liu H, Johnson KA. Stepwise connectivity of the modal cortex reveals the multimodal organization of the human brain. J Neurosci. 2012;32(31):10649–10661. doi: 10.1523/JNEUROSCI.0759-12.2012. [DOI] [PMC free article] [PubMed] [Google Scholar]
- 12.Mishkin M, Ungerleider LG. Contribution of striate inputs to the visuospatial functions of parieto-preoccipital cortex in monkeys. Behav Brain Res. 1982;6(1):57–77. doi: 10.1016/0166-4328(82)90081-x. [DOI] [PubMed] [Google Scholar]
- 13.Goodale MA, Milner AD. Separate visual pathways for perception and action. Trends Neurosci. 1992;15(1):20–25. doi: 10.1016/0166-2236(92)90344-8. [DOI] [PubMed] [Google Scholar]
- 14.Patterson K, Nestor PJ, Rogers TT. Where do you know what you know? the representation of semantic knowledge in the human brain. Nat Rev Neurosci. 2007;8(12):976–987. doi: 10.1038/nrn2277. [DOI] [PubMed] [Google Scholar]
- 15.Visser M, Jefferies E, Embleton KV, Lambon Ralph MA. Both the middle temporal gyrus and the ventral anterior temporal area are crucial for multimodal semantic processing: Distortion-corrected fMRI evidence for a double gradient of information convergence in the temporal lobes. J Cogn Neurosci. 2012;24(8):1766–1778. doi: 10.1162/jocn_a_00244. [DOI] [PubMed] [Google Scholar]
- 16.Koechlin E, Ody C, Kouneiher F. The architecture of cognitive control in the human prefrontal cortex. Science. 2003;302(5648):1181–1185. doi: 10.1126/science.1088545. [DOI] [PubMed] [Google Scholar]
- 17.Petrides M. In: From Monkey Brain to Human Brain. A Fyssen Foundation Symposium. Dehaene S, Duhamel J-R, Hauser MD, Rizzolatti G, editors. MIT Press; Cambridge, MA: 2005. pp. 293–314. [Google Scholar]
- 18.Badre D. Cognitive control, hierarchy, and the rostro-caudal organization of the frontal lobes. Trends Cogn Sci. 2008;12(5):193–200. doi: 10.1016/j.tics.2008.02.004. [DOI] [PubMed] [Google Scholar]
- 19.Badre D, D’Esposito M. Is the rostro-caudal axis of the frontal lobe hierarchical? Nat Rev Neurosci. 2009;10(9):659–669. doi: 10.1038/nrn2667. [DOI] [PMC free article] [PubMed] [Google Scholar]
- 20.Kaas JH. Topographic maps are fundamental to sensory processing. Brain Res Bull. 1997;44(2):107–112. doi: 10.1016/s0361-9230(97)00094-4. [DOI] [PubMed] [Google Scholar]
- 21.Kaas JH. The organization of neocortex in mammals: Implications for theories of brain function. Annu Rev Psychol. 1987;38:129–151. doi: 10.1146/annurev.ps.38.020187.001021. [DOI] [PubMed] [Google Scholar]
- 22.Goldberg E. Gradiental approach to neocortical functional organization. J Clin Exp Neuropsychol. 1989;11(4):489–517. doi: 10.1080/01688638908400909. [DOI] [PubMed] [Google Scholar]
- 23.Mesulam MM. From sensation to cognition. Brain. 1998;121(Pt 6):1013–1052. doi: 10.1093/brain/121.6.1013. [DOI] [PubMed] [Google Scholar]
- 24.Buckner RL, Krienen FM. The evolution of distributed association networks in the human brain. Trends Cogn Sci. 2013;17(12):648–665. doi: 10.1016/j.tics.2013.09.017. [DOI] [PubMed] [Google Scholar]
- 25.Shulman GL, et al. Common blood flow changes across visual tasks. II. Decreases in cerebral cortex. J Cogn Neurosci. 1997;9(5):648–663. doi: 10.1162/jocn.1997.9.5.648. [DOI] [PubMed] [Google Scholar]
- 26.Spreng RN, Grady CL. Patterns of brain activity supporting autobiographical memory, prospection, and theory of mind, and their relationship to the default mode network. J Cogn Neurosci. 2010;22(6):1112–1123. doi: 10.1162/jocn.2009.21282. [DOI] [PubMed] [Google Scholar]
- 27.Mason MF, et al. Wandering minds: The default network and stimulus-independent thought. Science. 2007;315(5810):393–395. doi: 10.1126/science.1131295. [DOI] [PMC free article] [PubMed] [Google Scholar]
- 28.Christoff K, Gordon AM, Smallwood J, Smith R, Schooler JW. Experience sampling during fMRI reveals default network and executive system contributions to mind wandering. Proc Natl Acad Sci USA. 2009;106(21):8719–8724. doi: 10.1073/pnas.0900234106. [DOI] [PMC free article] [PubMed] [Google Scholar]
- 29.Stawarczyk D, Majerus S, Maquet P, D’Argembeau A. Neural correlates of ongoing conscious experience: Both task-unrelatedness and stimulus-independence are related to default network activity. PLoS One. 2011;6(2):e16997. doi: 10.1371/journal.pone.0016997. [DOI] [PMC free article] [PubMed] [Google Scholar]
- 30.Smallwood J, et al. Representing representation: Integration between the temporal lobe and the posterior cingulate influences the content and form of spontaneous thought. PLoS One. 2016;11(4):e0152272. doi: 10.1371/journal.pone.0152272. [DOI] [PMC free article] [PubMed] [Google Scholar]
- 31.Weissman DH, Roberts KC, Visscher KM, Woldorff MG. The neural bases of momentary lapses in attention. Nat Neurosci. 2006;9(7):971–978. doi: 10.1038/nn1727. [DOI] [PubMed] [Google Scholar]
- 32.Vatansever D, Menon DK, Manktelow AE, Sahakian BJ, Stamatakis EA. Default mode dynamics for global functional integration. J Neurosci. 2015;35(46):15254–15262. doi: 10.1523/JNEUROSCI.2135-15.2015. [DOI] [PMC free article] [PubMed] [Google Scholar]
- 33.Konishi M, McLaren DG, Engen H, Smallwood J. Shaped by the past: The default mode network supports cognition that is independent of immediate perceptual input. PLoS One. 2015;10(6):e0132209. doi: 10.1371/journal.pone.0132209. [DOI] [PMC free article] [PubMed] [Google Scholar]
- 34.Spreng RN, et al. Goal-congruent default network activity facilitates cognitive control. J Neurosci. 2014;34(42):14108–14114. doi: 10.1523/JNEUROSCI.2815-14.2014. [DOI] [PMC free article] [PubMed] [Google Scholar]
- 35.Crittenden BM, Mitchell DJ, Duncan J. Recruitment of the default mode network during a demanding act of executive control. eLife. 2015;4:e06481. doi: 10.7554/eLife.06481. [DOI] [PMC free article] [PubMed] [Google Scholar]
- 36.Krieger-Redwood K, et al. Down but not out in posterior cingulate cortex: Deactivation yet functional coupling with prefrontal cortex during demanding semantic cognition. Neuroimage. 2016;141:366–377. doi: 10.1016/j.neuroimage.2016.07.060. [DOI] [PMC free article] [PubMed] [Google Scholar]
- 37.van den Heuvel MP, Sporns O. Network hubs in the human brain. Trends Cogn Sci. 2013;17(12):683–696. doi: 10.1016/j.tics.2013.09.012. [DOI] [PubMed] [Google Scholar]
- 38.Jbabdi S, Sotiropoulos SN, Behrens TE. The topographic connectome. Curr Opin Neurobiol. 2013;23(2):207–215. doi: 10.1016/j.conb.2012.12.004. [DOI] [PMC free article] [PubMed] [Google Scholar]
- 39.Van Essen DC, et al. The WU-Minn human connectome project: An overview. Neuroimage. 2013;80:62–79. doi: 10.1016/j.neuroimage.2013.05.041. [DOI] [PMC free article] [PubMed] [Google Scholar]
- 40.Glasser MF, et al. The minimal preprocessing pipelines for the human connectome project. Neuroimage. 2013;80:105–124. doi: 10.1016/j.neuroimage.2013.04.127. [DOI] [PMC free article] [PubMed] [Google Scholar]
- 41.Haak KV, Marquand AF, Beckmann CF. 2016. Connectopic mapping with resting-state fMRI. arXiv:1602.07100.
- 42.Coifman RR, et al. Geometric diffusions as a tool for harmonic analysis and structure definition of data: Diffusion maps. Proc Natl Acad Sci USA. 2005;102(21):7426–7431. doi: 10.1073/pnas.0500334102. [DOI] [PMC free article] [PubMed] [Google Scholar]
- 43.Hill J, et al. Similar patterns of cortical expansion during human development and evolution. Proc Natl Acad Sci USA. 2010;107(29):13135–13140. doi: 10.1073/pnas.1001229107. [DOI] [PMC free article] [PubMed] [Google Scholar]
- 44.Biswal BB, et al. Toward discovery science of human brain function. Proc Natl Acad Sci USA. 2010;107(10):4734–4739. doi: 10.1073/pnas.0911855107. [DOI] [PMC free article] [PubMed] [Google Scholar]
- 45.Wang D, et al. Parcellating cortical functional networks in individuals. Nat Neurosci. 2015;18(12):1853–1860. doi: 10.1038/nn.4164. [DOI] [PMC free article] [PubMed] [Google Scholar]
- 46.Gordon EM, Laumann TO, Adeyemo B, Petersen SE. Individual variability of the system-level organization of the human brain. Cereb Cortex. October 13, 2015 doi: 10.1093/cercor/bhv239. [DOI] [PMC free article] [PubMed] [Google Scholar]
- 47.Yarkoni T, Poldrack RA, Nichols TE, Van Essen DC, Wager TD. Large-scale automated synthesis of human functional neuroimaging data. Nat Methods. 2011;8(8):665–670. doi: 10.1038/nmeth.1635. [DOI] [PMC free article] [PubMed] [Google Scholar]
- 48.Fox PT, Lancaster JL. Opinion: Mapping context and content: The BrainMap model. Nat Rev Neurosci. 2002;3(4):319–321. doi: 10.1038/nrn789. [DOI] [PubMed] [Google Scholar]
- 49.Kiebel SJ, Daunizeau J, Friston KJ. A hierarchy of time-scales and the brain. PLoS Comput Biol. 2008;4(11):e1000209. doi: 10.1371/journal.pcbi.1000209. [DOI] [PMC free article] [PubMed] [Google Scholar]
- 50.Friston K. Life as we know it. J R Soc Interface. 2013;10(86):20130475. doi: 10.1098/rsif.2013.0475. [DOI] [PMC free article] [PubMed] [Google Scholar]
- 51.Schacter DL, Addis DR. The cognitive neuroscience of constructive memory: Remembering the past and imagining the future. Philos Trans R Soc Lond B Biol Sci. 2007;362(1481):773–786. doi: 10.1098/rstb.2007.2087. [DOI] [PMC free article] [PubMed] [Google Scholar]
- 52.Binder JR, Desai RH, Graves WW, Conant LL. Where is the semantic system? a critical review and meta-analysis of 120 functional neuroimaging studies. Cereb Cortex. 2009;19(12):2767–2796. doi: 10.1093/cercor/bhp055. [DOI] [PMC free article] [PubMed] [Google Scholar]
- 53.Jefferies E. The neural basis of semantic cognition: Converging evidence from neuropsychology, neuroimaging and TMS. Cortex. 2013;49(3):611–625. doi: 10.1016/j.cortex.2012.10.008. [DOI] [PubMed] [Google Scholar]
- 54.Constantinescu AO, O’Reilly JX, Behrens TEJ. Organizing conceptual knowledge in humans with a gridlike code. Science. 2016;352(6292):1464–1468. doi: 10.1126/science.aaf0941. [DOI] [PMC free article] [PubMed] [Google Scholar]
- 55.Amodio DM, Frith CD. Meeting of minds: The medial frontal cortex and social cognition. Nat Rev Neurosci. 2006;7(4):268–277. doi: 10.1038/nrn1884. [DOI] [PubMed] [Google Scholar]
- 56.Amft M, et al. Definition and characterization of an extended social-affective default network. Brain Struct Funct. 2015;220(2):1031–1049. doi: 10.1007/s00429-013-0698-0. [DOI] [PMC free article] [PubMed] [Google Scholar]
- 57.Fellows LK. Orbitofrontal contributions to value-based decision making: Evidence from humans with frontal lobe damage. Ann N Y Acad Sci. 2011;1239:51–58. doi: 10.1111/j.1749-6632.2011.06229.x. [DOI] [PubMed] [Google Scholar]
- 58.Chau BKH, Kolling N, Hunt LT, Walton ME, Rushworth MFS. A neural mechanism underlying failure of optimal choice with multiple alternatives. Nat Neurosci. 2014;17(3):463–470. doi: 10.1038/nn.3649. [DOI] [PMC free article] [PubMed] [Google Scholar]
- 59.Goulas A, Uylings HBM, Stiers P. Mapping the hierarchical layout of the structural network of the macaque prefrontal cortex. Cereb Cortex. 2014;24(5):1178–1194. doi: 10.1093/cercor/bhs399. [DOI] [PubMed] [Google Scholar]
- 60.Nee DE, D’Esposito M. The hierarchical organization of the lateral prefrontal cortex. eLife. March 21, 2016. [DOI] [PMC free article] [PubMed]
- 61.Glasser MF, et al. A multi-modal parcellation of human cerebral cortex. Nature. 2016;536(7615):171–178. doi: 10.1038/nature18933. [DOI] [PMC free article] [PubMed] [Google Scholar]
- 62.Haggard P. Human volition: Towards a neuroscience of will. Nat Rev Neurosci. 2008;9(12):934–946. doi: 10.1038/nrn2497. [DOI] [PubMed] [Google Scholar]
- 63.Smith SM, et al. A positive-negative mode of population covariation links brain connectivity, demographics and behavior. Nat Neurosci. 2015;18(11):1565–1567. doi: 10.1038/nn.4125. [DOI] [PMC free article] [PubMed] [Google Scholar]
- 64.Spreng RN, Stevens WD, Chamberlain JP, Gilmore AW, Schacter DL. Default network activity, coupled with the frontoparietal control network, supports goal-directed cognition. Neuroimage. 2010;53(1):303–317. doi: 10.1016/j.neuroimage.2010.06.016. [DOI] [PMC free article] [PubMed] [Google Scholar]
- 65.Beaty RE, et al. Creativity and the default network: A functional connectivity analysis of the creative brain at rest. Neuropsychologia. 2014;64:92–98. doi: 10.1016/j.neuropsychologia.2014.09.019. [DOI] [PMC free article] [PubMed] [Google Scholar]
- 66.Broyd SJ, et al. Default-mode brain dysfunction in mental disorders: A systematic review. Neurosci Biobehav Rev. 2009;33(3):279–296. doi: 10.1016/j.neubiorev.2008.09.002. [DOI] [PubMed] [Google Scholar]
- 67.Stephan KE, et al. Advanced database methodology for the Collation of Connectivity data on the Macaque brain (CoCoMac) Philos Trans R Soc Lond B Biol Sci. 2001;356(1412):1159–1186. doi: 10.1098/rstb.2001.0908. [DOI] [PMC free article] [PubMed] [Google Scholar]
- 68.Bakker R, Wachtler T, Diesmann M. CoCoMac 2.0 and the future of tract-tracing databases. Front Neuroinform. 2012;6:30. doi: 10.3389/fninf.2012.00030. [DOI] [PMC free article] [PubMed] [Google Scholar]
- 69.Mitchell JSB, Mount DM, Papadimitriou CH. The discrete geodesic problem. SIAM J Comput. 1987;16(4):647–668. [Google Scholar]
- 70.O’Rourke J. Computational geometry column 35. Int J Comp Geom Appl. 1999;9(4-5):513–515. [Google Scholar]
- 71.Marcus DS, et al. Informatics and data mining tools and strategies for the human connectome project. Front Neuroinform. 2011;5:4. doi: 10.3389/fninf.2011.00004. [DOI] [PMC free article] [PubMed] [Google Scholar]
- 72.Fischl B. FreeSurfer. Neuroimage. 2012;62(2):774–781. doi: 10.1016/j.neuroimage.2012.01.021. [DOI] [PMC free article] [PubMed] [Google Scholar]
- 73.Jenkinson M, Bannister P, Brady M, Smith S. Improved optimization for the robust and accurate linear registration and motion correction of brain images. Neuroimage. 2002;17(2):825–841. doi: 10.1016/s1053-8119(02)91132-8. [DOI] [PubMed] [Google Scholar]
- 74.Jenkinson M, Beckmann CF, Behrens TEJ, Woolrich MW, Smith SM. FSL. Neuroimage. 2012;62(2):782–790. doi: 10.1016/j.neuroimage.2011.09.015. [DOI] [PubMed] [Google Scholar]
- 75.Van Essen DC, Glasser MF, Dierker DL, Harwell J, Coalson T. Parcellations and hemispheric asymmetries of human cerebral cortex analyzed on surface-based atlases. Cereb Cortex. 2012;22(10):2241–2262. doi: 10.1093/cercor/bhr291. [DOI] [PMC free article] [PubMed] [Google Scholar]
- 76.Van Essen DC. Surface-based approaches to spatial localization and registration in primate cerebral cortex. Neuroimage. 2004;23(Suppl 1):S97–S107. doi: 10.1016/j.neuroimage.2004.07.024. [DOI] [PubMed] [Google Scholar]
- 77.Von Bonin G, Bailey P. The Neocortex of Macaca Mulatta. University of Illinois Press; Champaign, IL: 1947. [Google Scholar]
- 78.Bezgin G, Vakorin VA, van Opstal AJ, McIntosh AR, Bakker R. Hundreds of brain maps in one atlas: Registering coordinate-independent primate neuro-anatomical data to a standard brain. Neuroimage. 2012;62(1):67–76. doi: 10.1016/j.neuroimage.2012.04.013. [DOI] [PubMed] [Google Scholar]
- 79.Lafon S, Lee AB. Diffusion maps and coarse-graining: A unified framework for dimensionality reduction, graph partitioning, and data set parameterization. IEEE Trans Pattern Anal Mach Intell. 2006;28(9):1393–1403. doi: 10.1109/TPAMI.2006.184. [DOI] [PubMed] [Google Scholar]
- 80.Ye AQ, et al. The intrinsic geometry of the human brain connectome. Brain Inform. 2015;2(4):197–210. doi: 10.1007/s40708-015-0022-2. [DOI] [PMC free article] [PubMed] [Google Scholar]
- 81.Atasoy S, Donnelly I, Pearson J. Human brain networks function in connectome-specific harmonic waves. Nat Commun. 2016;7:10340. doi: 10.1038/ncomms10340. [DOI] [PMC free article] [PubMed] [Google Scholar]
- 82.Von Luxburg U. A tutorial on spectral clustering. Stat Comput. 2007;17(4):395–416. [Google Scholar]
- 83.Tenenbaum JB, De Silva V, Langford JC. A global geometric framework for nonlinear dimensionality reduction. Science. 2000;290(5500):2319–2323. doi: 10.1126/science.290.5500.2319. [DOI] [PubMed] [Google Scholar]
- 84.Langs G, Golland P, Tie Y, Rigolo L, Golby AJ. Functional geometry alignment and localization of brain areas. Adv Neural Inf Process Syst. 2010;1:1225–1233. [PMC free article] [PubMed] [Google Scholar]
- 85.Langs G, Tie Y, Rigolo L, Golby AJ, Golland P. Localization of language areas in brain tumor patients by functional geometry alignment. In: Shen D, et al., editors. Proceedings of the MICCAI Workshop on Computational Imaging Biomarkers for Tumors. Beijing, China: 2010. Available at www.spl.harvard.edu/publications/item/view/2112. Accessed September 9, 2016. [Google Scholar]
- 86.Langs G, Menze BH, Lashkari D, Golland P. Detecting stable distributed patterns of brain activation using gini contrast. Neuroimage. 2011;56(2):497–507. doi: 10.1016/j.neuroimage.2010.07.074. [DOI] [PMC free article] [PubMed] [Google Scholar]
- 87.Langs G, et al. Learning an atlas of a cognitive process in its functional geometry. Inf Process Med Imaging. 2011;22:135–146. doi: 10.1007/978-3-642-22092-0_12. [DOI] [PMC free article] [PubMed] [Google Scholar]
- 88.Langs G, et al. Decoupling function and anatomy in atlases of functional connectivity patterns: Language mapping in tumor patients. Neuroimage. 2014;103:462–475. doi: 10.1016/j.neuroimage.2014.08.029. [DOI] [PMC free article] [PubMed] [Google Scholar]
- 89.Langs G, Golland P, Ghosh SS. Predicting activation across individuals with resting-state functional connectivity based multi-atlas label fusion. In: Navab N, Hornegger J, Wells WM, Frangi AF, editors. Medical Image Computing and Computer-Assisted Intervention–MICCAI 2015, Lecture Notes in Computer Science. Vol 9350. Springer; Berlin: 2015. pp. 313–320. [DOI] [PMC free article] [PubMed] [Google Scholar]
- 90.Fox PT, Lancaster JL, Laird AR, Eickhoff SB. Meta-analysis in human neuroimaging: Computational modeling of large-scale databases. Annu Rev Neurosci. 2014;37:409–434. doi: 10.1146/annurev-neuro-062012-170320. [DOI] [PMC free article] [PubMed] [Google Scholar]
- 91.Laird AR, et al. Behavioral interpretations of intrinsic connectivity networks. J Cogn Neurosci. 2011;23(12):4022–4037. doi: 10.1162/jocn_a_00077. [DOI] [PMC free article] [PubMed] [Google Scholar]
- 92.Rottschy C, et al. Differentiated parietal connectivity of frontal regions for “what” and “where” memory. Brain Struct Funct. 2013;218(6):1551–1567. doi: 10.1007/s00429-012-0476-4. [DOI] [PMC free article] [PubMed] [Google Scholar]


