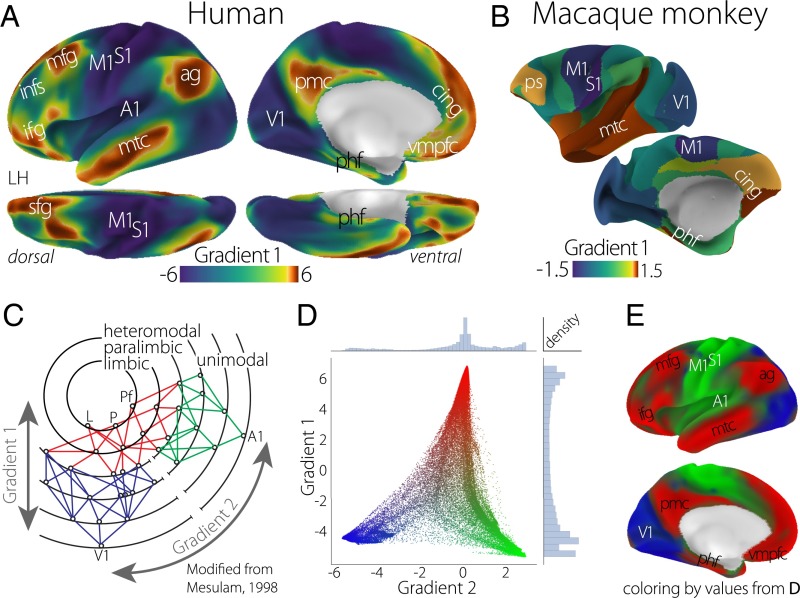
Fig. 1.
The principal gradient of connectivity in both the (A) human and (B) macaque monkey cortices shows a spectrum between unimodal regions (dark blue) and transmodal regions (sienna), which in the human cortex, peaks in regions corresponding to the DMN. The proximity of colors can be interpreted as greater similarity of connectivity patterns. (C) The illustration of connectivity organization suggested by Mesulam (23) proposes a hierarchy of processing from distinct unimodal areas to integrative transmodal areas. Labels Gradient 1 and Gradient 2, which were not included in the original figure, correspond to the results in D. Modified from ref. 23. (D) A scatter plot of the first two connectivity embedding gradients. Gradient 1 extends between primary sensorimotor and transmodal regions (red). Gradient 2 separates somatomotor and auditory cortex (green) from visual cortex (blue). Histograms depicting the distribution of values are presented on the respective axes. (E) Colors from the scatter plot are presented on the cortical surface for anatomical orientation. A1, primary auditory; ag, angular gyrus; cing, anterior cingulate cortex; ifg, inferior frontal gyrus; infs, intermediate frontal sulcus; L, limbic; M1, primary motor; mfg, middle frontal gyrus; mtc, middle temporal cortex; P, parietal; Pf, prefrontal; phf, parahippocampal formation; pmc, posteromedial cortex; ps, principal sulcus; S1, primary somatosensory; sfg, superior frontal gyrus; V1, primary visual; vmpfc, ventromedial prefrontal cortex.

