Fig. 6.
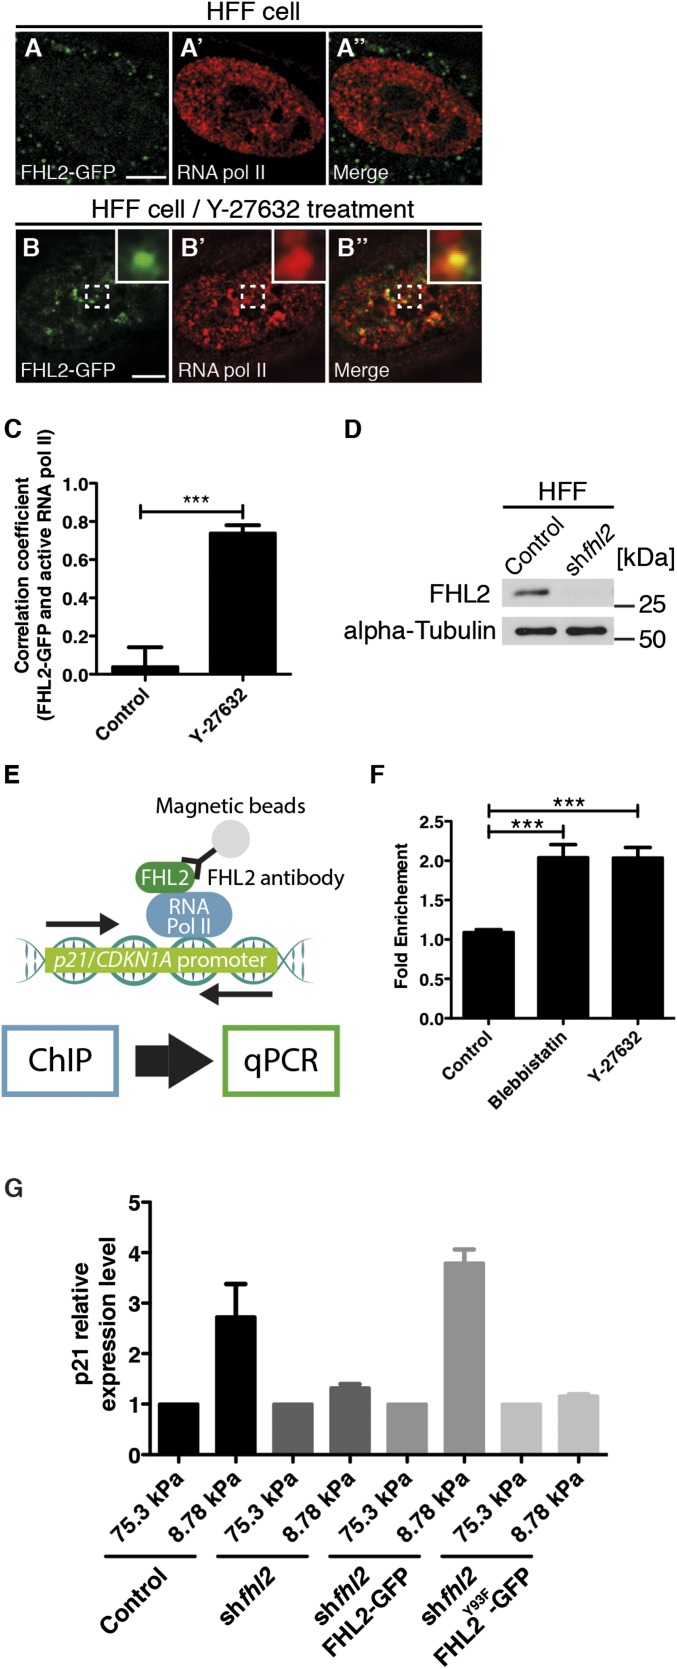
Nuclear FHL2 colocalizes with RNA Pol II and promotes p21 gene expression. The images were obtained using a Nikon N-SIM superresolution microscope. (A) FHL2-GFP localization at the nucleus in an HFF cell. (A′) RNA polymerase II staining at the nucleus in an HFF cell. (A′′) Merged image of A and A′. (B) FHL2-GFP localization at the nucleus in an HFF cell after Y-27632 treatment. (B′) RNA polymerase II staining at the nucleus in an HFF cell after Y-27632 treatment. (B′′) Merged image of A and A′. In B and B′′, the dotted white box indicates the magnified region shown in the Inset. (C) Graph showing the Pearson’s correlation coefficient of images between FHL2-GFP and RNA polymerase II staining at the nucleus in HFF cells with and without Y-27632 treatment. (D) Western blots showing the efficiency of FHL2 gene suppression in HFF cells infected with control or FHL2 shRNA-expressing retrovirus. (E) Schematic illustrating quantitative real-time PCR after the ChIP assay. (F) Graph showing normalized fold enrichment of DNA in the p21 gene promoter region after the ChIP assay. (G) Graph showing relative gene expression level of p21 gene in HFF cell with various conditions. The p21 expression level in 75.3-kPa ACA acrylamide gel served as a reference. (Scale bars: 5 μm.) All images are projected images from adhesion sections to nuclear sections. n > 15. Error bars represent SEM. ***P < 0.0001.

