Fig. S1.
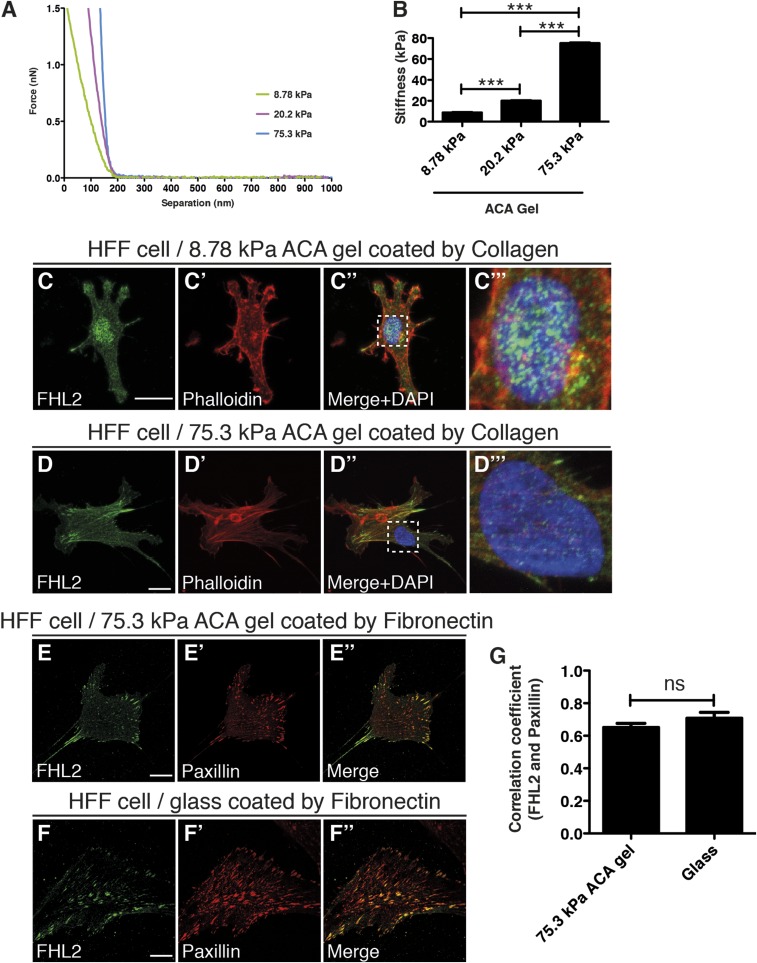
Characterization of ACA gel stiffness and FHL2 localization in HFF cells on ACA gel. (A) Representative force curve for the characterization of ACA gel stiffness. (B) Graph showing the stiffness of each gel. (C–C′′) FHL2 and phalloidin staining of HFF cells on the 8.78-kPa ACA gel coated with collagen. (C′′′) The box in C′′, magnified. (D–D′′) FHL2 and phalloidin staining of HFF cells on the 75.3-kPa ACA gel coated with collagen. (D′′′) The box in D′′, magnified. (E–E′′) FHL2 and paxillin staining of HFF cells on the 75.3-kPa ACA gel coated with fibronectin. (F–F′′) FHL2 and paxillin staining of HFF cells on glass coated with fibronectin. (G) Graph showing the correlation coefficient between the intensity of FHL2 staining and the intensity of paxillin staining on a 75.3-kPa ACA gel or glass coated with fibronectin.

