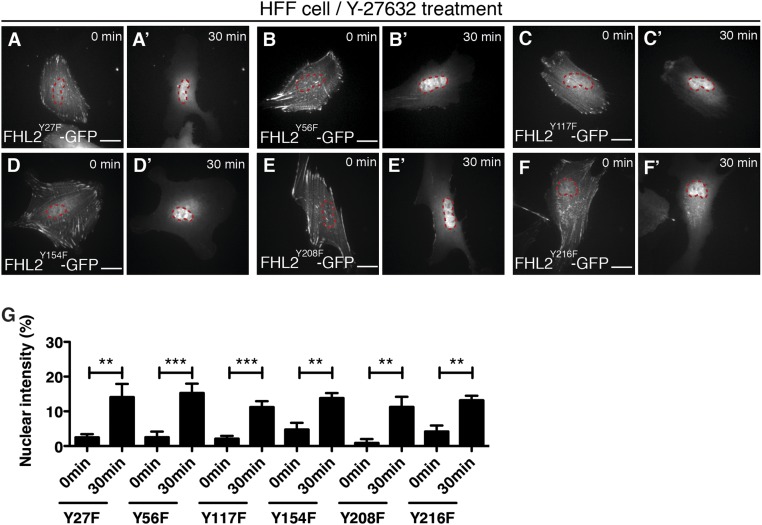
Fig. S9.
FHL2 nuclear localization with mutations of tyrosine residues in FHL2. (A–F′) Dynamics of FHL2-GFP with mutations at each tyrosine after Y-27632 treatment. The magenta circle indicates NLS-BFP (nuclear marker). (G) Graph showing the relative intensity of FHL2-GFP with mutation at each tyrosine after Y-27632 treatment. All images are projected images from adhesion sections to nuclear sections. n > 10. Error bars represent SEM. **P < 0.001; ***P < 0.0001.

