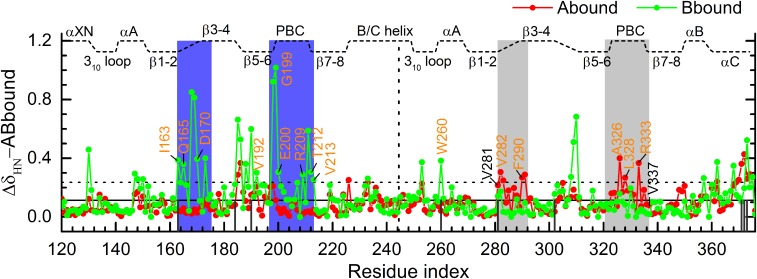
Fig. 4.
Backbone amide chemical shift perturbations (CSPs) of Abound (red) and Bbound (green) relative to ABbound. The mean CSP among the residues of both Abound and Bbound is indicated by the horizontal solid line; the value at 1 SD above the mean is indicated by the dashed line. Regions with significant calculated CSPs are highlighted by blue shading. Residues showing significant observed CSPs (7) are labeled in orange letters. Non-PBC residues within 4.5 Å of the cAMPs in 1RGS are indicated by black vertical lines.

