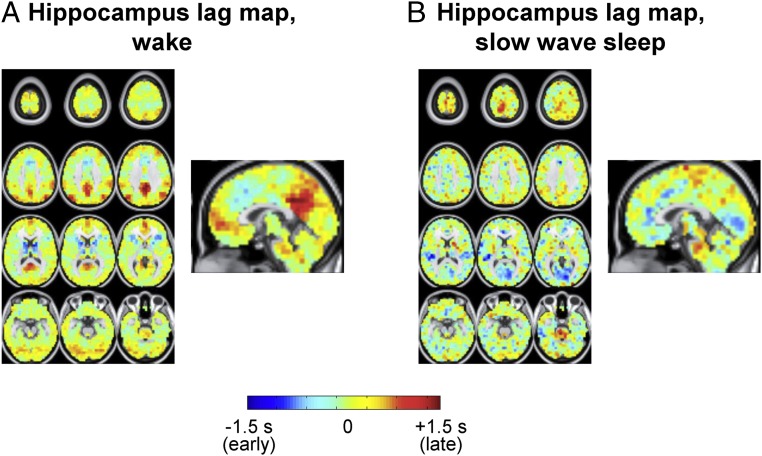
Fig. 3.
Hippocampus seed-based lag maps (using the ROI in Fig. 2A) of infraslow rs-fMRI BOLD activity in wake (A) and SWS (B). Maps depict the mean delay between each voxel and the hippocampus seed region. Negative lag values indicate regions where activity leads the hippocampus; positive lag values indicate regions where activity follows the hippocampus. The range of lags is ∼ ±1 s as shown in the color scale.

