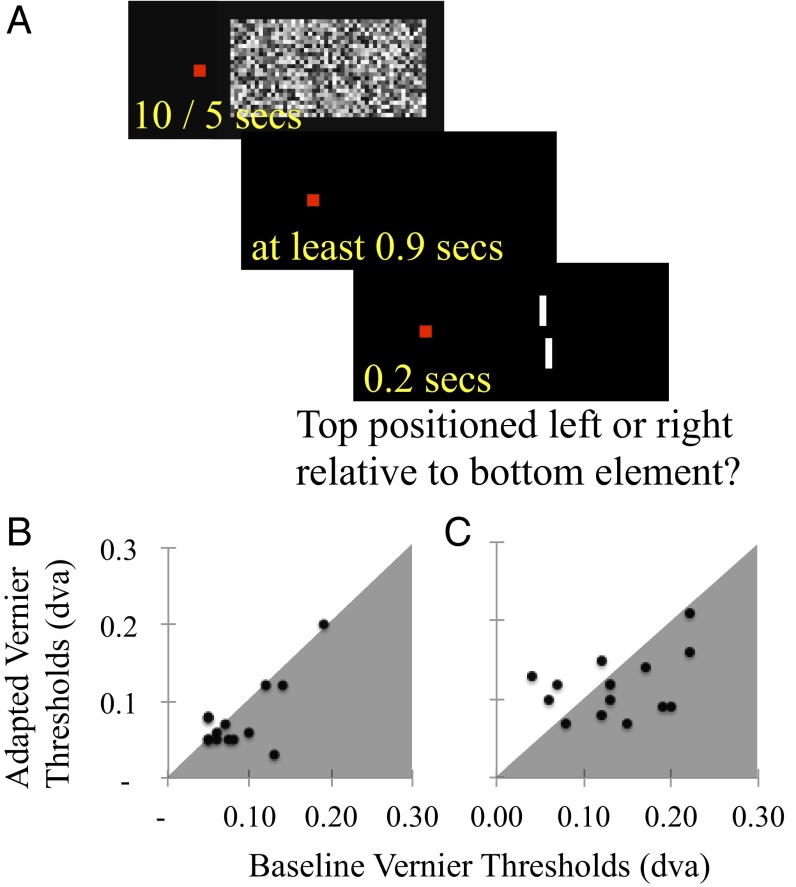
Fig. 2.
(A) Depiction of a trial sequence during a block of adaptation trials in experiment 2. On each trial, the participant viewed dynamic noise (60 Hz) centered to the right of fixation, for 10 s on the first trial, and for 5 s on all subsequent trials. Then there was a 400-ms interstimulus interval, before fixation monitoring commenced. Test presentations, lasting 200 ms, were triggered once 500 ms of stable fixation had been achieved—so tests followed adaptors by at least 900 ms. (B and C) Scatterplots of individual adapted (vertical axes) and unadapted baseline (horizontal axes) vernier thresholds from experiment 3. Data are plotted separately for average test eccentricities of 10 (B) and 20 (C) dva. Data points in gray shaded regions indicate improved vernier acuity post-FFAd; points in unshaded regions indicate poorer acuity.

