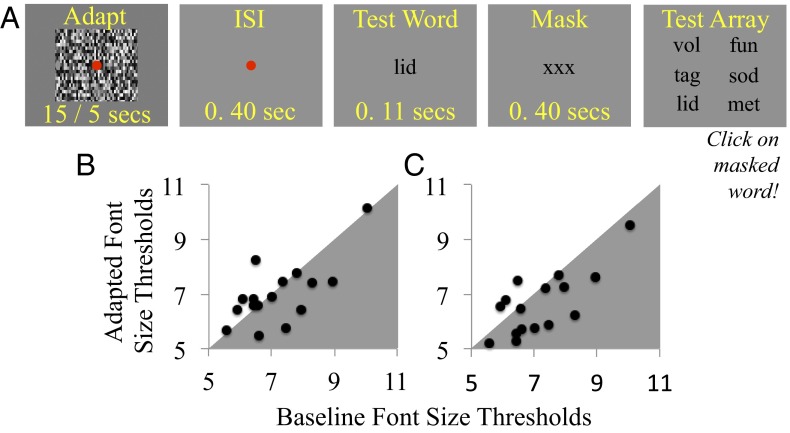
Fig. 3.
(A) Depiction of a trial sequence during an adaptation trial of experiment 3. (B and C) Scatterplots of individual adapted (vertical axes) and unadapted baseline (horizontal axes) font-size thresholds from experiment 4. Data are plotted separately for SFAd (B) and FFAd (C). Data points falling in gray shaded regions indicate improved sensitivity postadaptation; points in unshaded regions indicate poorer sensitivity.

