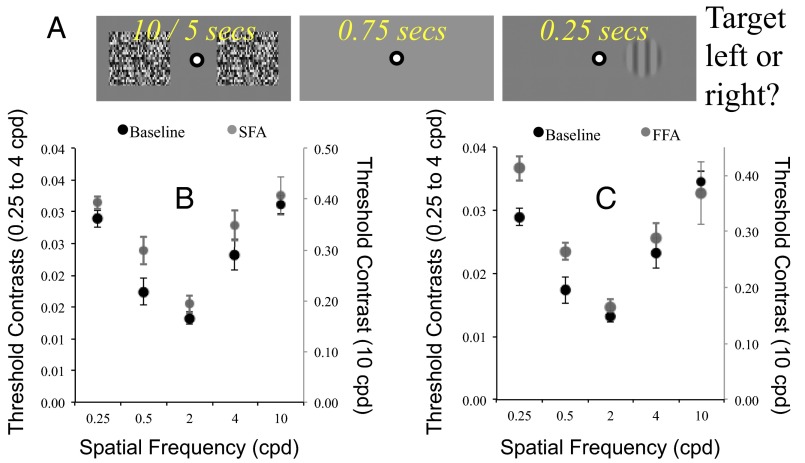
Fig. 4.
(A) Depiction of a trial sequence during a block of adaptation trials in experiment 4. (B) Contrast thresholds, averaged across participants, as a function of test spatial frequency at baseline (black) and post-SFAd (gray). (C) As for B, for baseline (black) and FFAd (gray). Error bars denote ±1 SEM.

