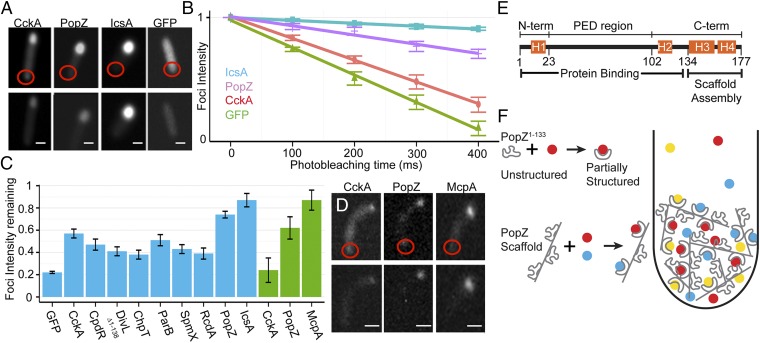
Fig. 6.
Protein dynamics in vivo. (A) Examples of FLIP in E. coli cells, shown before and after photobleaching. The targeted area is shown as a red circle. CckA-GFP was coexpressed with mChy-PopZ. (B) Loss of polar fluorescence intensity over successive rounds of photobleaching, plotted on a log scale. (C) Levels of polar fluorescence remaining after 200 ms photobleaching. Data from E. coli and Caulobacter cells are shown as blue and green bars, respectively. In E. coli, PopZ binding partners were coexpressed with mChy-PopZ. (D) Examples of the FLIP assay in Caulobacter cells. (E) Functional regions in the primary sequence of PopZ. (F) A model of PopZ’s role in polar organization. Colored circles represent proteins that bind to the intrinsically disordered region. The diagram shows a macromolecular complex at a cell pole. PopZ binding partners become concentrated as they undergo repeated cycles of binding, unbinding, diffusion, and rebinding within the PopZ network. (Scale bars, 1 μm.)

