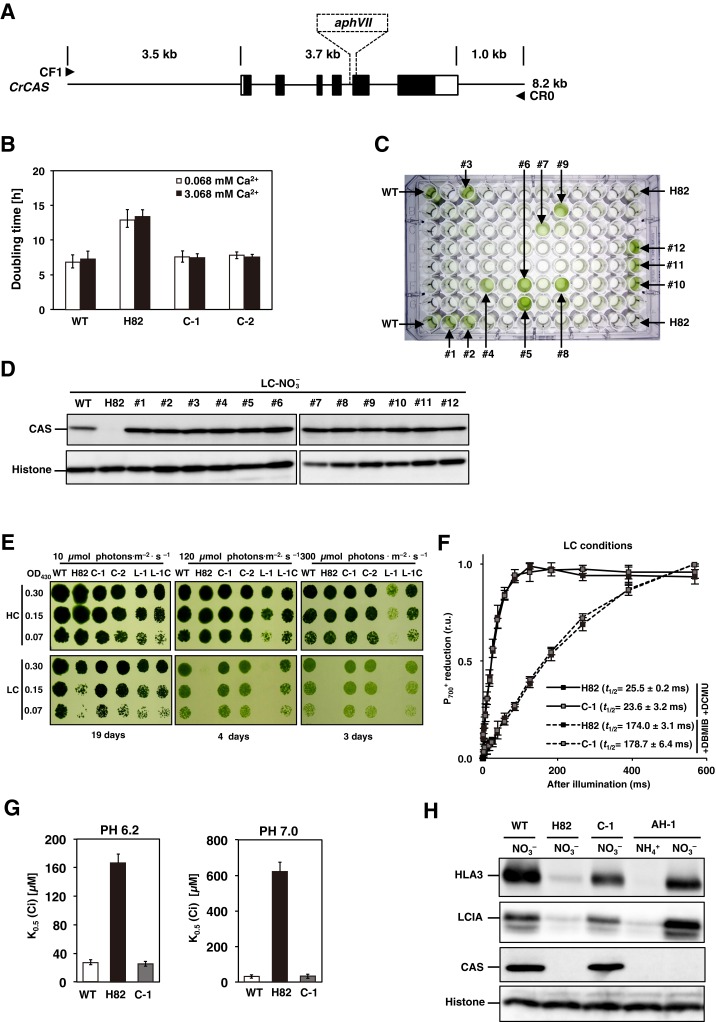
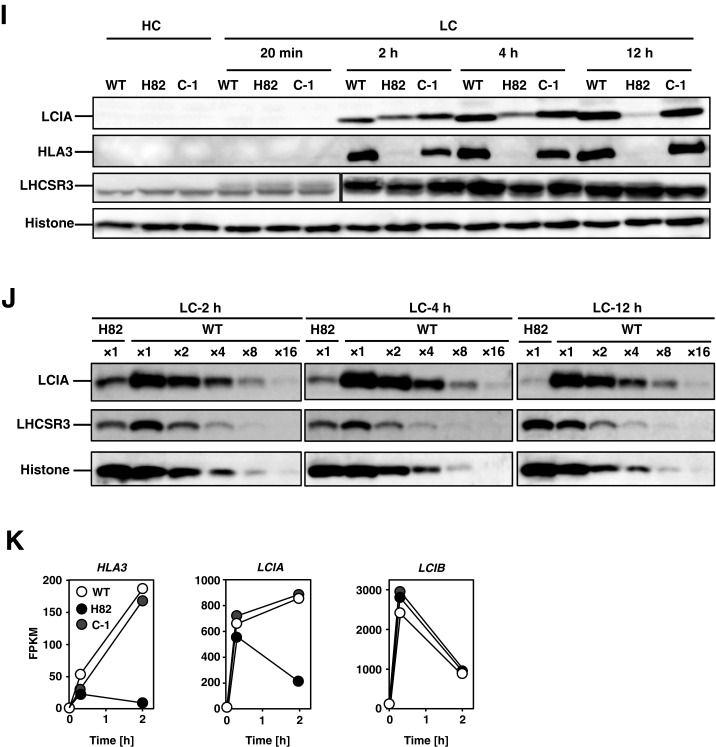
Fig. S1.
Photosynthetic characterization of CAS insertion mutant (H82) and its complemented strains. (A) Schematic representation of the fragment introduced into H82 cells for complementation and the insertion of the aphVII cassette in the genome of strain H82. The solid rectangles indicate the exons of the CAS gene. The open rectangles represent the 5′ UTR (Left) and 3′ UTR (Right). The fragment was amplified using primers CF1 and CR0. The broken lines indicate the insertion of aphVII into the genome of the H82 mutant. (B) The doubling time of WT, H82, and its complemented strains (C-1 and C-2) in low-CO2 (LC) conditions at pH 7.0. The respective doubling times of 7.0, 7.6 h, and 7.8 h of WT, C-1, and C-2 cells were shorter than the 13.0 h for H82 in LC conditions. The optical density at 730 nm was measured at four time points (0, 12, 24, and 36 h) for calculating the doubling time. High-CO2 (HC)-grown WT cells were centrifuged and resuspended by fresh HSM medium in the presence of the indicated concentration of CaCl2 and switched to LC conditions. (C) Growth phenotype of WT, H82, and 92 paromomycin-resistance transformants obtained by transforming plasmid pTY2b-CAS into H82 cells in LC conditions for 24 h. Twelve strains showing similar growth rates with WT were designated as #1 to #12. (D) Accumulation of CAS in the WT and obtained 12 complemented strains under LC conditions for 12 h in the presence of . (E) Spot test of WT, H82, complemented strains of H82 (C-1 and C-2), and pgrl1 mutant (L-1) cells, as well as its complemented strain (L-1C) for growth in HC and LC conditions. Cells grown to logarithmic phase were diluted to the indicated optical density (OD430: 0.3, 0.15, and 0.07); then, 3 µL of cell suspension was spotted onto six HSM agar plates and incubated in HC or LC chambers with the indicated light intensity for the indicated periods. (F) reduction kinetics of H82 and C-1 cells grown in LC conditions. The kinetics were measured after actinic light illumination for 10 s and then switching to dark periods. These curves show the kinetics of reduction after cessation of actinic light exposure. The kinetics were recorded in the presence of 10 μM dichlorophenyl-dimethylurea (DCMU) (solid line) or 10 μM DCMU and 2 μM 2,5-dibromo-3-methyl-6-isopropylbenzoquinone (DBMIB) (broken line). The time periods required for half reduction of (t1/2) were calculated. Data in all measurements are mean values ± SD from three biological replicates. (G) Inorganic carbon (Ci) affinity of WT, H82, and C-1 grown in LC conditions for 12 h. Photosynthetic oxygen evolution was measured in external dissolved Ci concentrations at pH 6.2 or pH 7.0. The K0.5 (Ci) values were calculated as the Ci concentration required for half maximum oxygen-evolving activity. Data from all experiments show mean values ± SD from three biological replicates. (H) Accumulation of LCIA, HLA3, and CAS in WT, H82, C-1, and AH-1 cells. Cells were grown in HSM medium with (HSM-) or NO3− (HSM-NO3−) as the nitrogen source in LC conditions for 12 h. Histone H3 was used as a loading control. (I and J) Accumulation of HLA3, LCIA, and LHCSR3 in WT, H82, and C-1. HC-grown cells were transferred to LC conditions for 20 min, 2 h, 4 h, or 12 h before sampling. Cells were illuminated in 120 µmol photons∙m–2∙s–1. Histone H3 was used as a loading control. To compare the accumulation levels of LHCSR3 in H82 cells with that of WT, aliquots of total cell protein corresponding to 1 µg of chlorophyll were loaded in the lane designated ×1, and the same amount of protein was serially diluted 2 to 16 times and loaded in the lanes designated ×2, ×4, ×8, and ×16, respectively. (K) Time course of fragments per kilobase of exon per million fragments mapped (FPKM) values of LCIA, HLA3, and LCIB in WT, H82, and C-1 cells. Each strain grown in HC (0 h) conditions was transferred to LC conditions for 0.3 or 2 h. FPKM values were calculated from two biological replicates.


