Fig. 4.
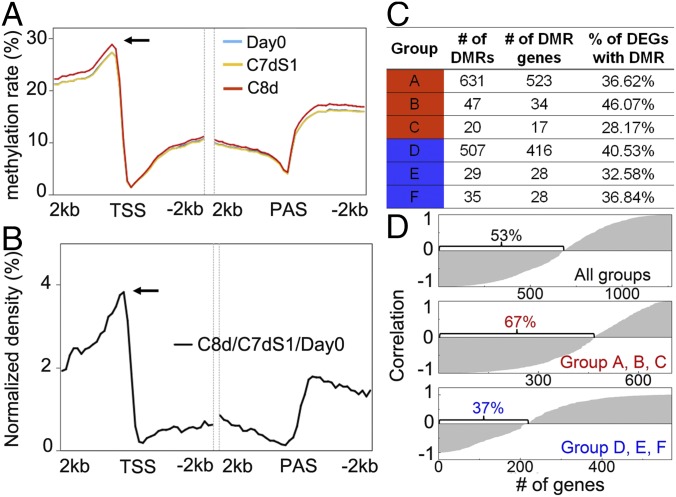
DNA methylation analysis of Ailsa Craig fruit in response to cold storage. (A) Change in cytosine methylation rate in genic regions (bin size, 100 bp). Arrow indicates methylation peak at 300–400 bp upstream of the TSS; PAS, polyadenylation site. (B) Distribution of DMRs in regions of gene promoters and bodies (bin size, 100 bp). (C) Number of DMRs and genes with DMRs in the promoter regions in the six groups defined in Fig. 2A. Percentage of DEGs with DMR was represented as a ratio between number of DMR genes and number of DEGs in each group shown in Fig. 2A. Groups A, B, and C are genes whose transcripts were significantly reduced by cold storage, whereas groups D, E, and F are genes induced by cold storage. (D) Correlation of methylation and transcripts. Percentage is the number of genes with negative correlation between methylation and transcripts divided by total number of genes in group.

