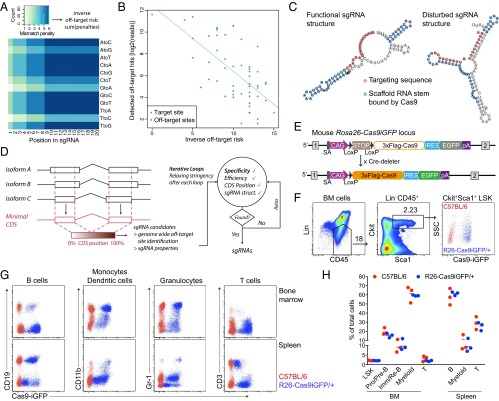
Fig. 1.
Design of efficient sgRNAs and characterization of Cas9-transgenic animals. (A) Heatmap showing mismatch penalties depending on the position within the targeting sequence of the sgRNA and the type of mismatch. Scores were chosen to fit the off-target frequencies detected by Tsai et al. (15). (B) Dotplot of the predicted inverse off-target risk of each off-target site of the VEGFA_3 sgRNA versus the reported GUIDEseq read numbers. Read numbers were extracted from Tsai et al. (15). (C) Predicted secondary structure of two sgRNAs targeting mouse Btk. sgRNAs with low binding energy between the targeting sequence and the scaffold RNA do not disturb the secondary structure of the scaffold RNA (Left), in contrast to sgRNAs with high binding energies between the targeting sequence and the scaffold RNA (Right). (D) Scheme of the CrispRGold sgRNA design tool. (E) Scheme of the R26-LSL-Cas9iGFP allele before (Top) and after crossing to Cre-deleter mice (Bottom). Cre-mediated removal of the LSL cassette leads to ubiquitous expression of Cas9 and GFP in the entire mouse. (F) FACS analysis of GFP expression in HSCs, defined as the Lin−,CD45+,Sca1+cKit+ LSK population. LSK cells from wild-type C57BL/6 mice (red) and R26-Cas9iGFP/+ mice (blue) are shown on the same FACS plot (Right). (G) FACS analysis of GFP expression in B cells (CD19+), monocytes/dendritic cells (CD11b+), granulocytes (Gr-1+), and T cells (CD3+). Cells were isolated from the BM (Top) or spleen (Bottom). Cells from wild-type C57BL/6 mice (red) and R26-Cas9iGFP/+ mice (blue) are shown in the same FACS plots. (H) Percentages of the indicated cell populations within all cells in the BM (Left) or the spleen (Right) of wild-type animals (red) or R26-Cas9iGFP/+ animals (blue). Each dot represents one mouse.

