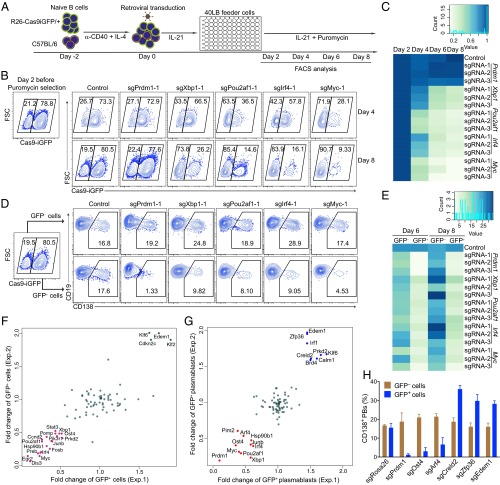
Fig. 3.
Identification of genes involved in B-cell activation and differentiation using robust CRISPR-mediated screening. (A) Scheme of CRISPR-mediated screening in primary B cells. GFP+ splenic B cells from R26-Cas9iGFP/+ mice were mixed with GFP− wild-type B cells and treated as indicated in the 96-well system. The cells were analyzed by flow cytometry at the indicated time points. (B) FACS analysis of mixed GFP+/GFP− B cells 4 or 6 d after transduction with empty vector (control), sgPrdm1-1, sgXbp1-1, sgPou2af1-1, sgIrf4-1, or sgMyc-1. The gates show the percentage of GFP+ and GFP− B cells after gating on BFP+ cells. (C) Heatmap of the percentages of GFP+ B cells at day 4, 6, or 8 normalized to day 2. One control sgRNA and three different sgRNAs per TF were used to knockout Prdm1, Xbp1, Pou2af1, Irf4, or Myc. (D) FACS analysis of plasma cell differentiation, indicated by the expression of CD138, in the same experiment as in B. Gates are set on CD138+ plasmablasts in GFP− (Top) and GFP+ (Bottom) cells. (E) Heatmap of the percentages of CD138+ plasmablasts within the GFP+ and GFP− at the indicated time points. (F) Fold changes of the percentages of GFP+ B cells at day 8 after transduction with sgRNAs against the candidate genes in two independent experiments. The repressor genes are indicated in green and the enhancer genes are shown in magenta. Fold changes were normalized to the initial percentage of GFP+ cells. (G) Fold changes of the percentages of CD138+GFP+ plasmablasts at day 8 in the same experiment as in F. The repressor genes are indicated in blue and the enhancer genes are shown in red. (H) Validation of the newly identified genes important in plasma cell differentiation. Histogram showing the percentages of GFP+CD138+ and GFP−CD138+ plasmablasts 6 d after transduction with sgRNAs targeting Rosa26, Prdm1, Ost4, Arf4, Creld2, Zfp36, and Edem1.

