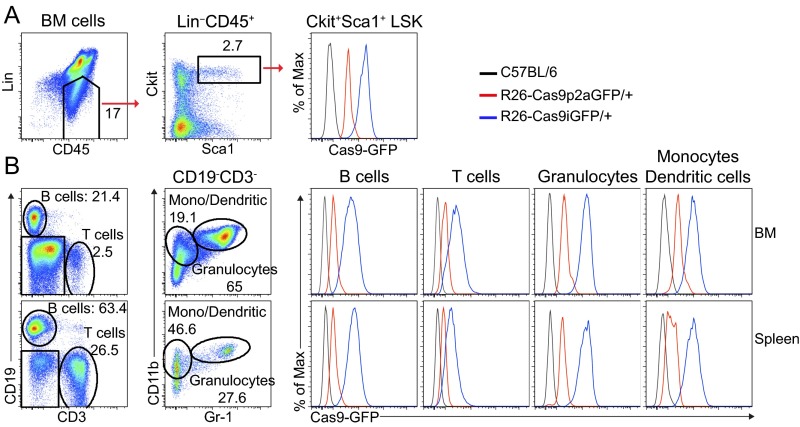
Fig. S2.
Comparison of GFP expression levels in HSCs of R26-Cas9iGFP and R26-Cas9p2aGFP mice. (A) FACS plots of HSCs (defined as Lin−Sca1+c-Kit+ or LSK), isolated from the BM of R26-Cas9iGFP/+ (blue), R26-Cas9p2aGFP/+ (red), and C57BL/6 (black) mice. (B) FACS plots of B cells (CD19+), T cells (CD3+), granulocytes (Gr1+CD11b+), and monocytes/dendritic cells (CD11b+Gr1−) isolated from the BM and spleen of R26-Cas9iGFP (blue), R26-Cas9p2aGFP (red), and wild-type (black) mice. The data are representative of two independent experiments.

