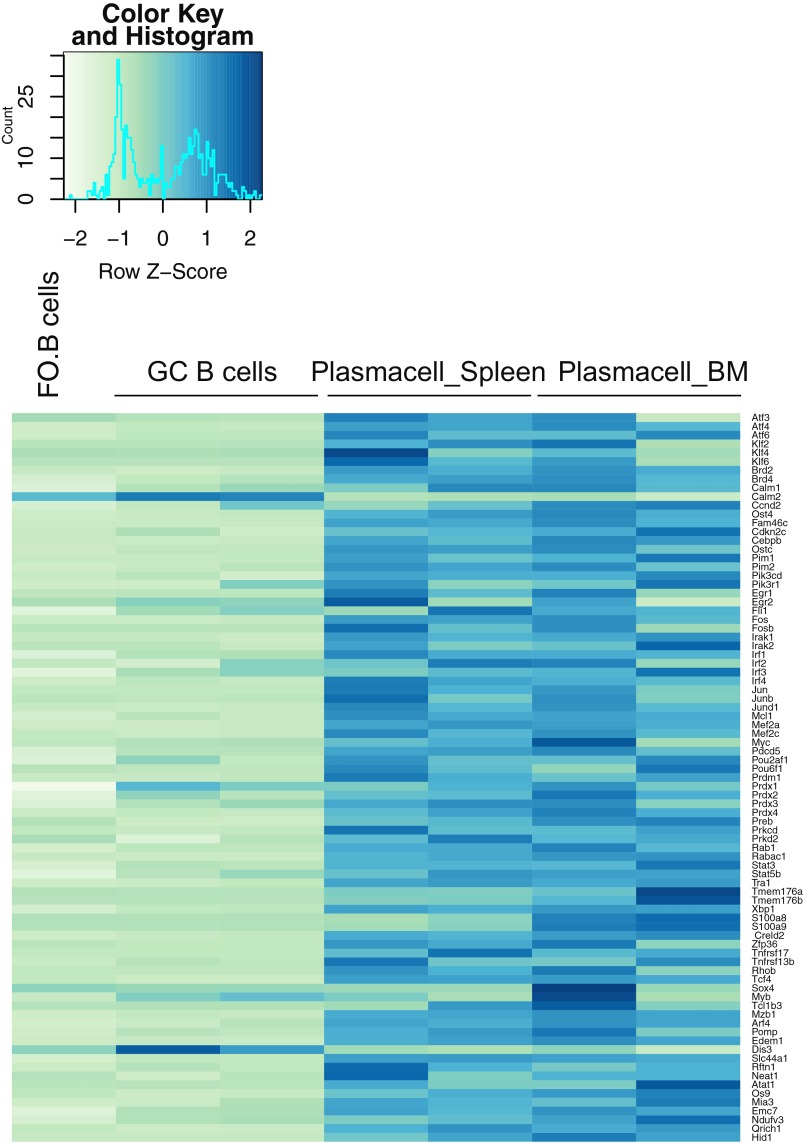
Fig. S7.
Gene set used for the small-scale screen. Total RNA was isolated from follicular B, GC, and plasma cells that were isolated from the spleen and BM of immunized animals. Microarrays were performed and data were normalized before analysis. The heatmap shows the expression levels of the selected genes with differential expression in the plasma cell populations.

