Fig. 2.
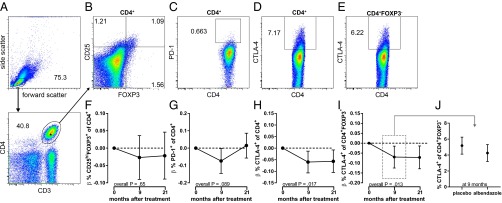
Effect of deworming on cell subsets and marker expression. Flow cytometry was performed on PBMCs from a subset of school children. Gating strategy is shown for (A) lymphocytes and CD4+ T cells, from which (B) CD25hiFOXP3+ Treg cell, (C) PD-1, and (D) CTLA-4 expressions on CD4+ T cells were derived. (E) CTLA-4 expression on CD25hiFOXP3− cells was gated from B. The estimated effect of albendazole treatment is shown for the time points 9 and 21 mo after the start of treatment for percentages of CD25hiFOXP3+ (F), PD-1+ (G), and CTLA-4+ (H) of CD4+ T cells and CTLA-4+ of CD4+FOXP3– cells (I). Estimates and β (beta) were obtained by linear mixed models; 95% CIs and overall P values over time (Ptime) are indicated. As an indication of magnitude of change, the actual percentage of CTLA-4+ of CD4+FOXP3– cells in placebo and albendazole groups is shown at 9 mo (J).

