. 2016 Mar;137(3):e20152959. doi: 10.1542/peds.2015-2959

FIGURE 1.

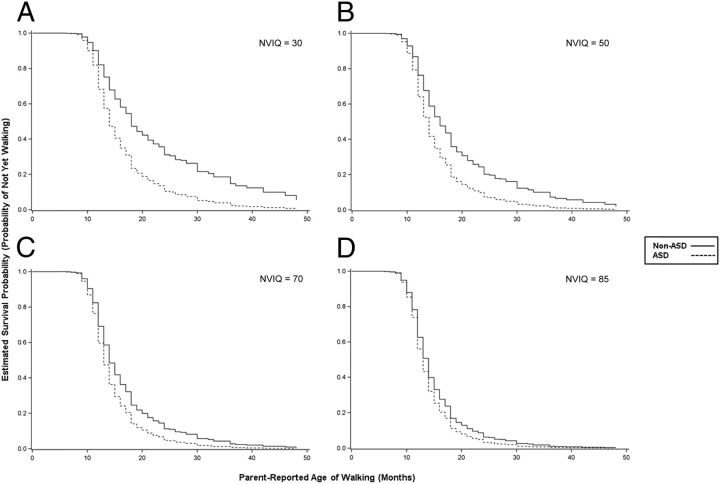
FIGURE 1. Significant interaction between diagnostic group and later NVIQ in Cox proportional hazards model (n = 1185). Estimated survival probability (y axis) reflects the probability of having not walked by a given time, controlling for NVIQ. The interaction of diagnostic group (ASD versus non-ASD) and later NVIQ was statistically significant: χ2 = 7.63, P = .0006. Shown are the survival curves for each diagnostic group, held constant at various levels of NVIQ. The successively smaller distance between the curves in A through D illustrate the convergence in hazards between groups as NVIQ increases. The point estimates of the hazard ratios for ASD versus non-ASD (with 95% confidence interval) were as follows: A, 1.94 (1.35–2.79); B, 1.65 (1.27–2.14); C, 1.40 (1.18–1.66); and D, 1.24 (1.08–1.42). Higher hazard ratios indicate greater hazard of the event (walking) for an individual in the ASD group, relative to the non-ASD group, at any given time.

Significant interaction between diagnostic group and later NVIQ in Cox proportional hazards model (n = 1185). Estimated survival probability (y axis) reflects the probability of having not walked by a given time, controlling for NVIQ. The interaction of diagnostic group (ASD versus non-ASD) and later NVIQ was statistically significant: χ2 = 7.63, P = .0006. Shown are the survival curves for each diagnostic group, held constant at various levels of NVIQ. The successively smaller distance between the curves in A through D illustrate the convergence in hazards between groups as NVIQ increases. The point estimates of the hazard ratios for ASD versus non-ASD (with 95% confidence interval) were as follows: A, 1.94 (1.35–2.79); B, 1.65 (1.27–2.14); C, 1.40 (1.18–1.66); and D, 1.24 (1.08–1.42). Higher hazard ratios indicate greater hazard of the event (walking) for an individual in the ASD group, relative to the non-ASD group, at any given time.