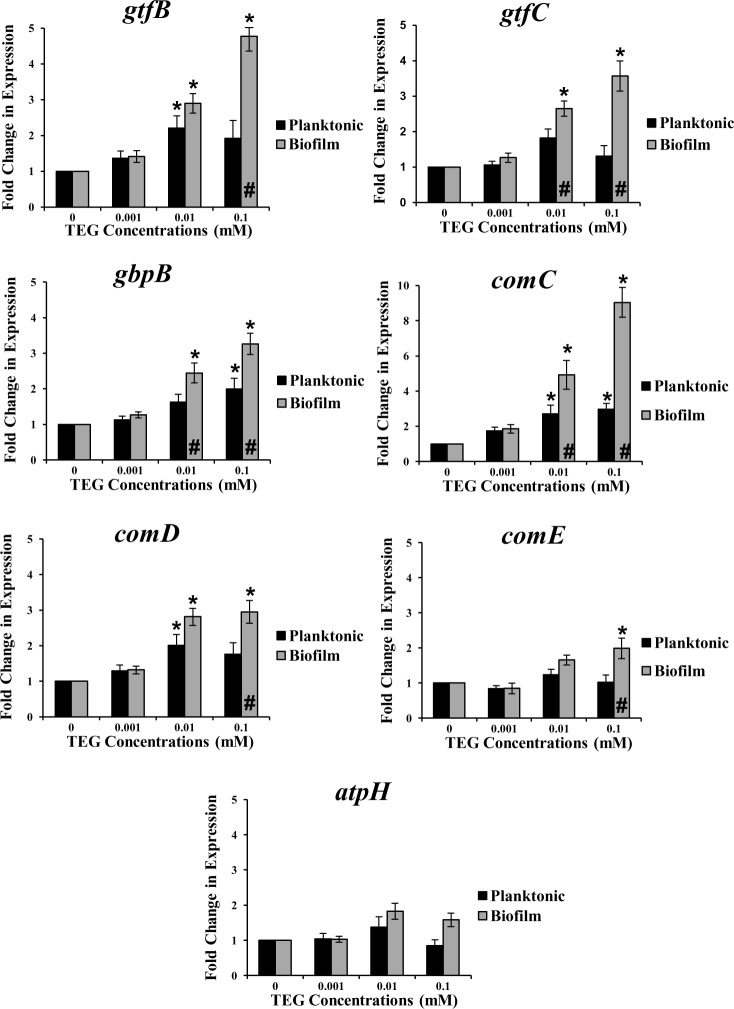
Fig 1. Relative expression of the S. mutans virulence genes: gtfB, gtfC, gbpB, comC, comD, comE and atpH for planktonic and biofilm growth conditions with different concentrations of TEG (0.001, 0.01 and 0.1 mM) at pH 5.5 relative to the no TEG control.
* represents significant difference between individual TEG concentrations compared to the control (no TEG) in either growth mode (P<0.05). # Represents significant difference between biofilm and planktonic cultures at the same TEG concentration (P<0.001). Data are plotted with standard error of the mean (±SE), n = 4.

