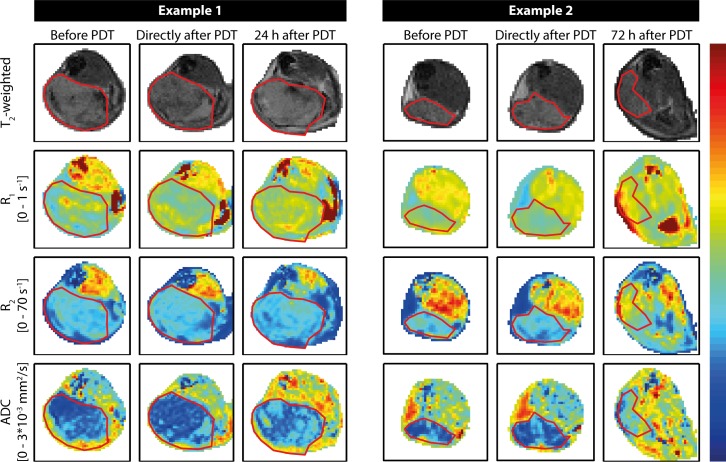
Fig 2. Representative examples of maps of endogenous MR parameters of two mice.
First, second, and third columns show measurements of a single mouse obtained before, right after, and 24 h after PDT, respectively. The other three columns contain data acquired before, right after, and at 72 h post PDT of another mouse. The upper row contains T2-weighted anatomical reference images, which were used for tumor segmentation, indicated by the red contours. Rows 2 to 4 show R1 maps, R2 maps, and ADC maps, respectively. The color bar corresponds to the range of values indicated on the left.

