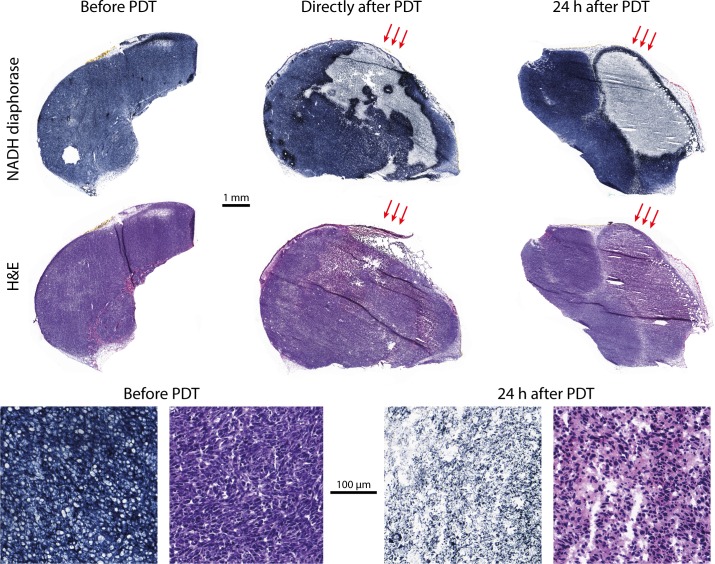
Fig 4. Representative examples of histology sections.
NADH diaphorase stained sections (top row) and H&E sections (middle row) of an untreated tumor (left), a tumor directly after PDT (center), and a tumor 24 h post PDT (right). Overall, control tumors were almost completely positively stained, indicating full viability. Directly after PDT, some negative (non-viable) patches were observed. After 24 h, tumors were mostly completely negatively stained, but for the specific section shown here the tumor also contained a large viable region. Red arrows indicate the angle of light incidence during PDT. In the bottom row, close-up images of a viable part in NADH and H&E stained sections are shown on the left. The two close-up images in the bottom right are NADH and H&E stained sections of a non-viable tumor, 24 h after PDT.

