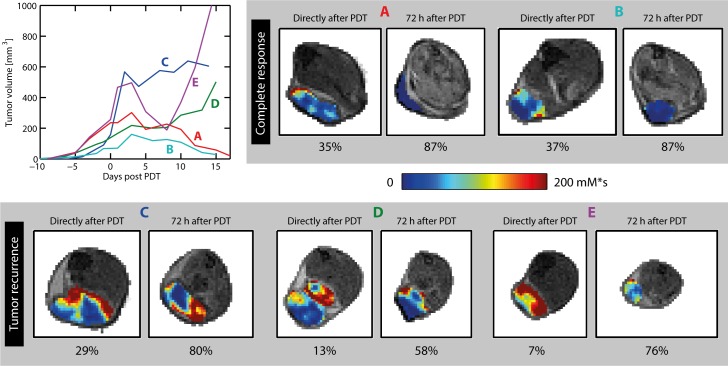
Fig 7. Tumor growth curves and contrast enhancement (AUC) maps of five mice.
For two animals (A and B), complete tumor remission was seen after 2 weeks. In the other 3 animals (C, D, and E), tumor growth arrest or volume reduction was seen in the first days after PDT, followed by recurrence of growth. For each animal, AUC maps of a single representative tumor slice are displayed, acquired right after PDT, and 72 h after PDT. The AUC in the tumor is color-coded on top of the grayscale anatomical reference images. At 72 h, no enhancement was observed in the tumors of mice A and B, while significant enhancement was seen in mice C-E. The non-enhanced volume fractions of the entire tumors are listed below the AUC maps.

