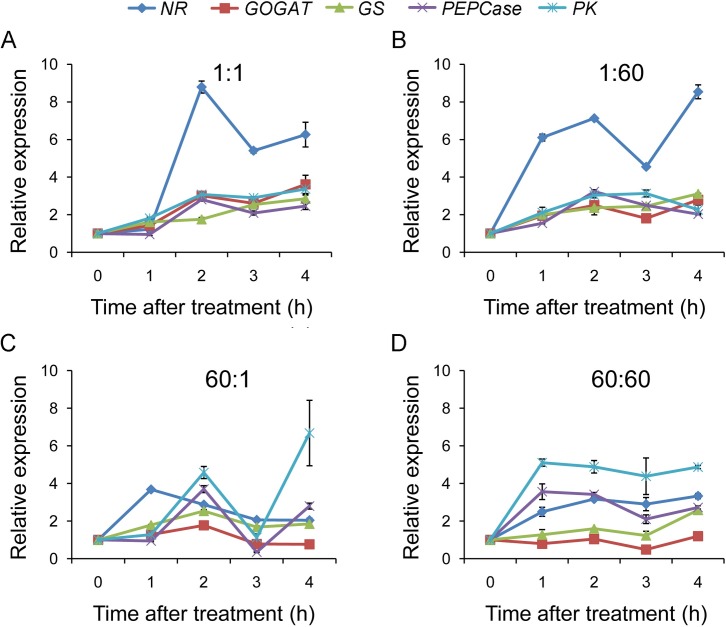
Fig 2. qRT-PCR analysis of CN metabolic genes at different time points after C:N treatments.
Expression patterns of NR, GOGAT, GS, PEPCase and PK were analyzed in rice seedlings treated with four different C:N conditions (A 1:1; B 1:60; C 60:1; D 60:60) for 1, 2, 3 and 4 h. The beginning of the treatment (0 h) was used as the control and Actin6 served as the internal reference. Values are shown as means ± SDs from three technical replicates. A representative experiment of two biological replicates is shown.

