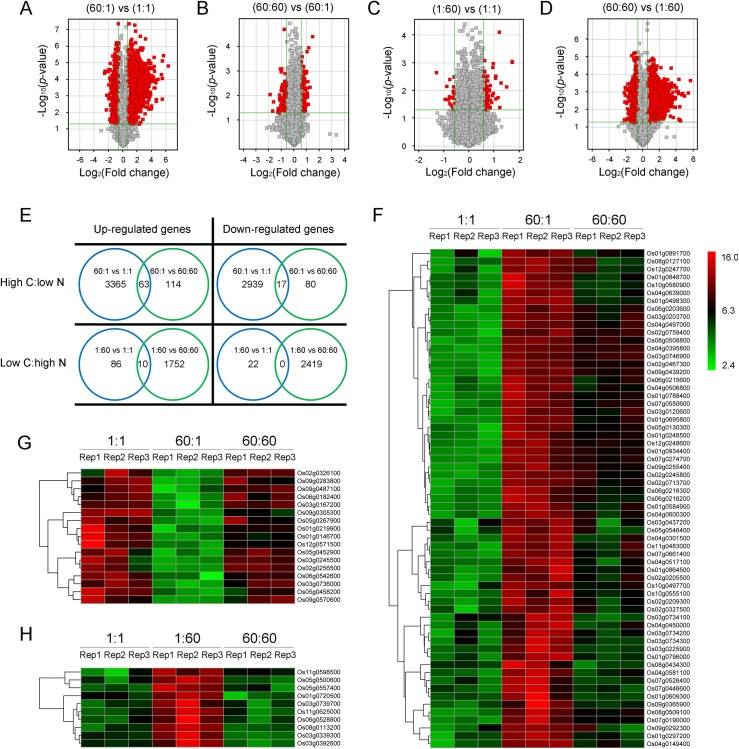
Fig 3. Identification of genes responsive to imbalanced high C:low N and low C:high N.
(A-D) The Volcano Plots for differentially expressed genes between treatments. The two vertical lines are the 1.5-fold change boundaries and the horizontal lines are the statistical significance boundaries (p<0.05). Genes with fold change>1.5 and statistical significance are marked with red dots. A, 60:1 compared with 1:1; B, 60:60 compared with 60:1; C, 1:60 compared with 1:1; D, 60:60 compared with 1:60. (E) Venn diagram of rice genes (probe sets) responded to C:N treatments. (F-H) Hierarchical cluster analysis of high C:low N and low C:high N responsive genes. The log2 ratio values of probe sets were used for the analysis with R software. The colored bars represent the value (log2(fold change)) of the transcripts in each bin after C:N treatments. Green represents down-regulated probe sets, red represents up-regulated probe sets, and dark indicates no significant difference in gene expression. F, High C:low N up-regulated genes; G, High C:low N down-regulated genes; H, Low C:high N up-regulated genes. “vs” represents “compared with”.

