Figure 3.
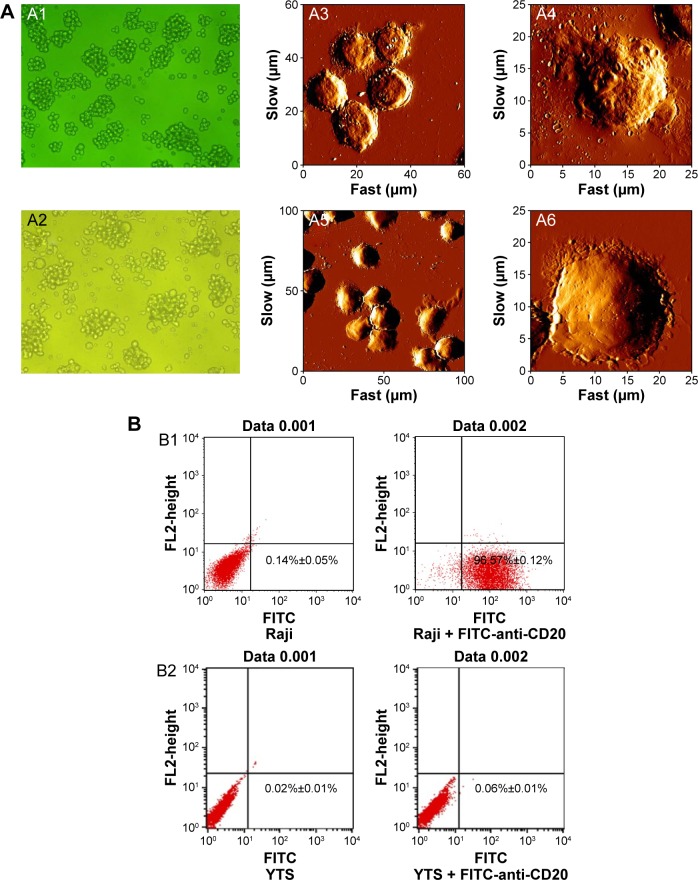
Morphology and characteristic marker identification of normal Raji (CD20+) cells and YTS (CD20−) cells.
Notes: (A) The images of light microscopy showed normal Raji grew in cohesive clusters (A1, ×200), and normal YTS cells were larger than Raji cells and were less cohesive when grown (A2, ×200). The images of AFM showed that the surface characteristics of Raji cells membrane appeared to be pitted (A3 and A4) and YTS cells were larger than Raji cells and had a smooth surface (A5 and A6). A4 and A6 are high-resolution single cell images of Raji and YTS cells, respectively. The image size of A3 is 60 μm × 60 μm, and the image size of A4 is 25 μm × 25 μm; the image size of A5 is 100 μm × 100 μm, and the image size of A6 is 25 μm × 25 μm. (B) Flow cytometry analysis of the positive rates of CD20 antigen of Raji (B1) was 96.71% and that of YTS (B2) was 0.06%, and data represent mean ± SD, n=3.
Abbreviations: AFM, atomic force microscopy; FL2, fluorescence channel 2; FITC, fluorescein isothiocyanate; μm, micrometer; SD, standard deviation.

