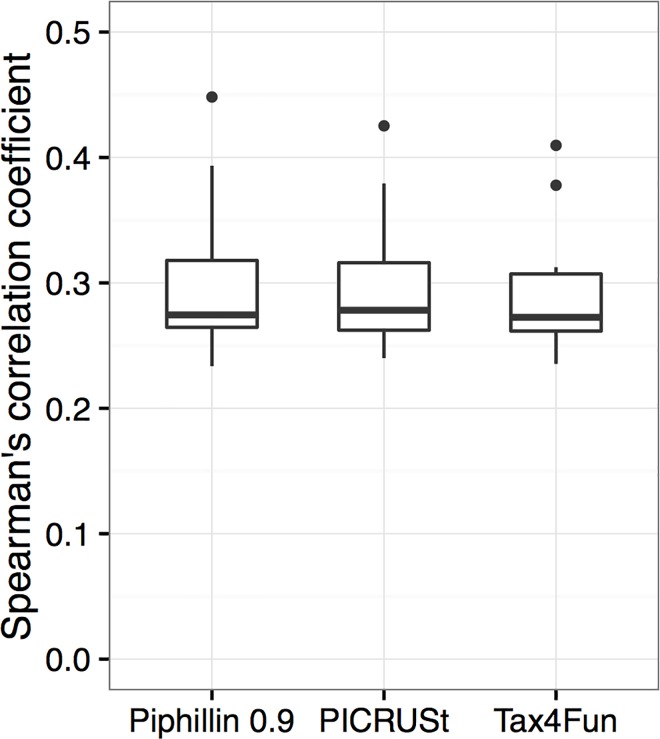
Fig 6. Comparison between Piphillin with 0.9 identity cutoff and two other approaches.
Spearman’s correlation coefficient against shotgun metagenomics results was calculated for hypersaline microbial mat dataset. Ranges are depicted as box and whisker plots as described in Fig 3.

