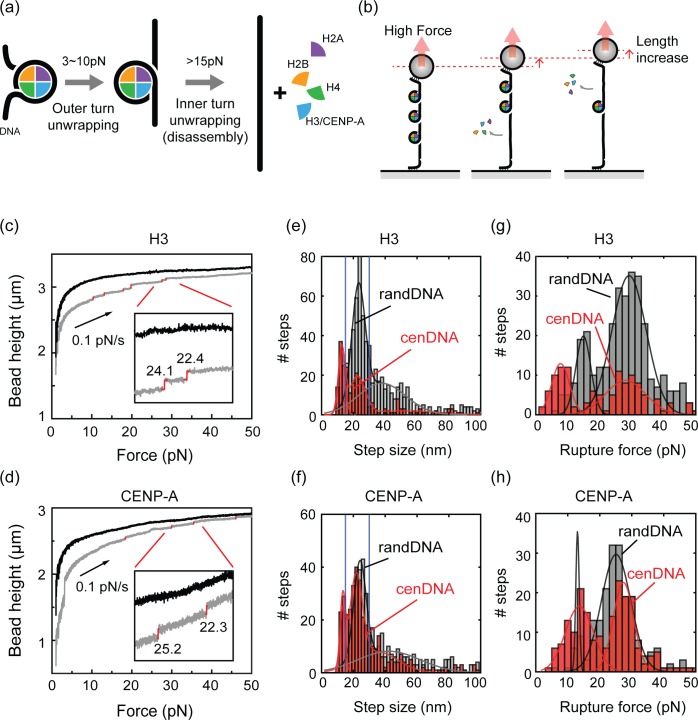
Fig 2. Real-time observation of nucleosome disassembly.
(a) Model for the two-step process of the nucleosome disruption. Both outer- and inner-turn unwrapping processes release about 20–25 nm of the bound DNA. (b) A schematic diagram of nucleosome disassembly. Unwrapping of the DNA from a nucleosome results in a stepwise increase in the DNA length. (c) Representative force-extension curves measured with random DNA sequence before (black) and after (grey) the H3 nucleosome assembly. The force-extension curves were measured from 1 pN to 50 pN at a constant speed of 0.1 pN/s. After the assembly, multiple stepwise increases of the DNA extension were observed. Step sizes (in nm) determined from a step-finding algorithm indicated with a red vertical line next to each event highlighted. Inset: Magnification of a small region showing two discrete steps. (d) Representative force-extension curves measured with random DNA before (black) and after (grey) the CENP-A nucleosome assembly. (e-f) Step-size distributions of (e) H3 and (f) CENP-A nucleosome disassembly from random DNA (grey bars) and centromeric DNA (red bars). Blue lines indicate the 15–30 nm range expected for single-nucleosomal DNA-unwrapping events. Solid lines are Gaussian fits and the fit parameters are summarized in S1 Table. (g-h) Rupture-force distributions of the selected 15–30 nm steps from (g) H3 and (h) CENP-A nucleosome disassembly. Color scheme is the same as in (e). Solid lines are Gaussian fits to the data and the fit parameters are summarized in S2 Table.

