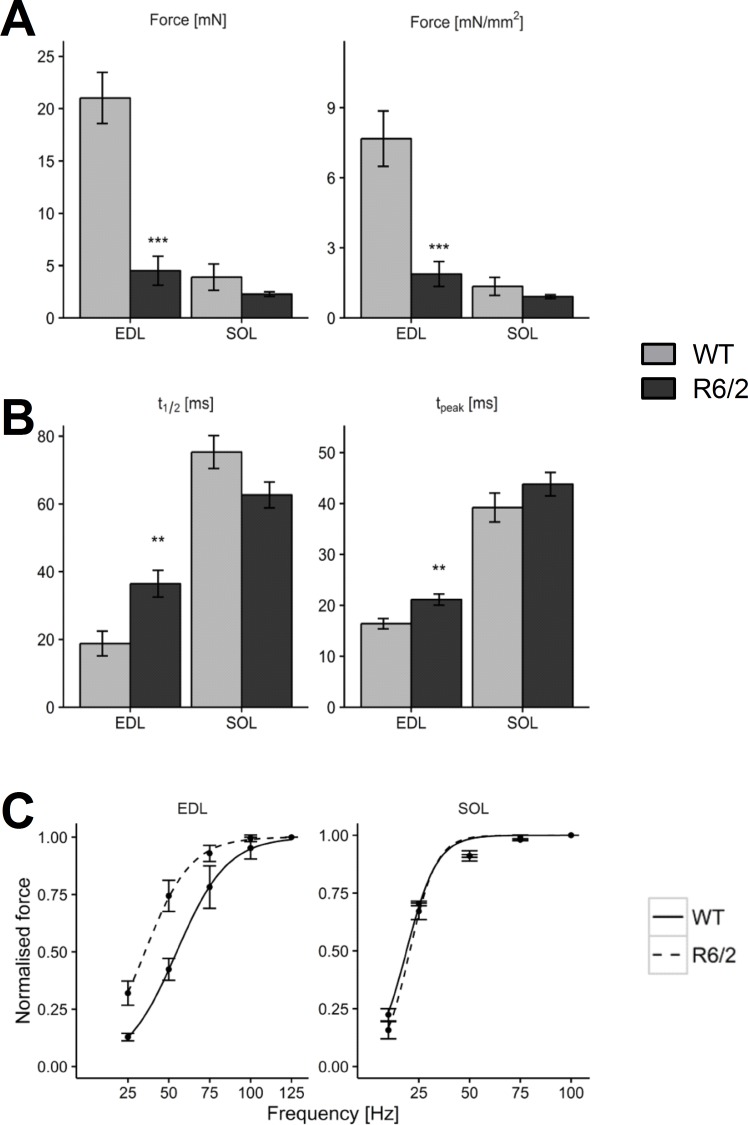
Fig 1. Lower force and slowed kinetics of contraction in R6/2.
(A) Mean twitch force (left panel) and specific force (i.e. normalized by cross sectional area; right panel) compared in EDL and SOL muscles of WT (n = 15 and n = 15, respectively) and R6/2 (n = 10 and n = 10, respectively). (B) Comparison of half time of relaxation (t1/2, left panel) and time to peak (tpeak, right panel). (C) Comparison of force frequency relations. Error bars indicate SEM.

