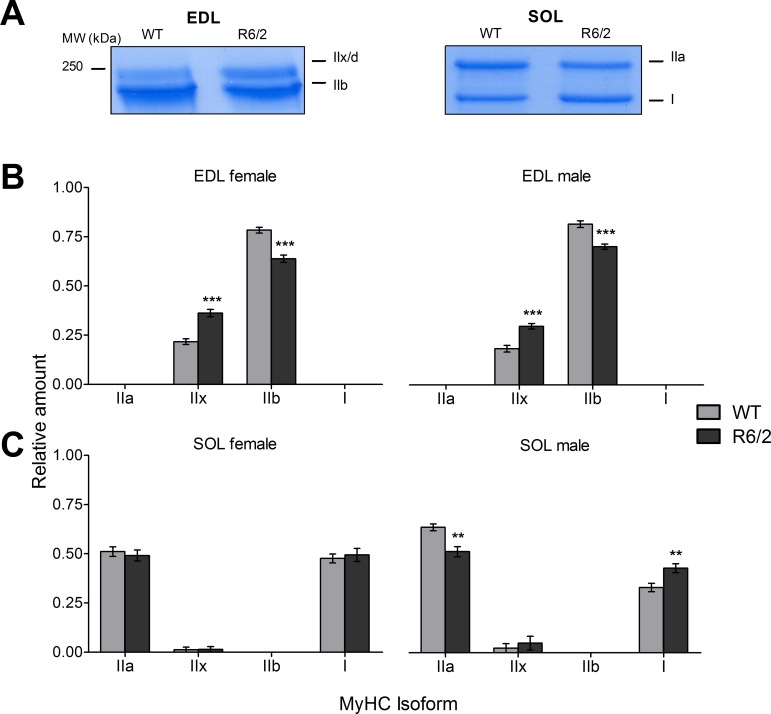
Fig 2. Relative content of myosin heavy chain isoforms in WT and R6/2 muscle.
(A) Examples showing sections of Roti®-Blue-stained gels exhibiting MyHC bands that were evaluated in the analysis. See also S1 Fig. (B) Relative amounts of the indicated MyHC isoforms in EDL of WT and R6/2, respectively, presented separately as results from female (left panel) and male specimen (right panel). (C) Relative amounts of the indicated MyHC isoforms in SOL of WT and R6/2, respectively, presented separately as results from female (left panel) and male (right panel) specimen. Error bars indicate SEM. n = 11 to 13 mice.

