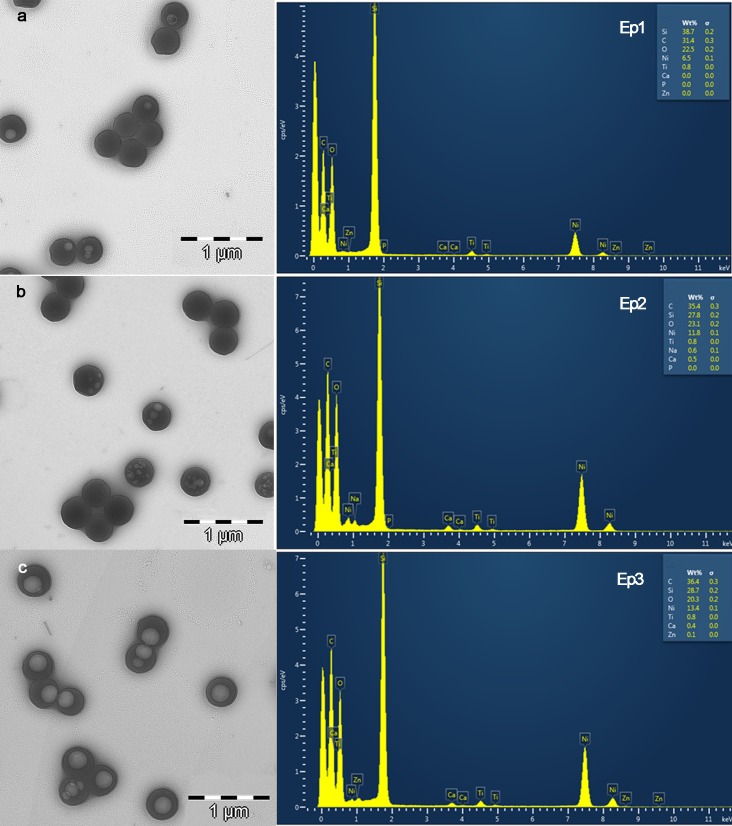
Fig 2. TEM images of NPs.
a. Non-loaded NPs, zinc and calcium are absent in the EDX spectrum (Ep1). b. Calcium loaded NPs. Calcium is detected in the EDX spectrum analysis (Ep2) c. Zn loaded NPs. Zinc and calcium were detected in the EDX spectrum analysis (Ep3). Light circular objects inside of the NPs were artifacts that developed during electron beam transmission. Ni, Si and Ti in the EDX spectra were contaminant elements from the sample holder. Presented EDX spectra correspond to qualitative analysis and to determine the identification of the elements present and is not a normalized quantitative analysis.

