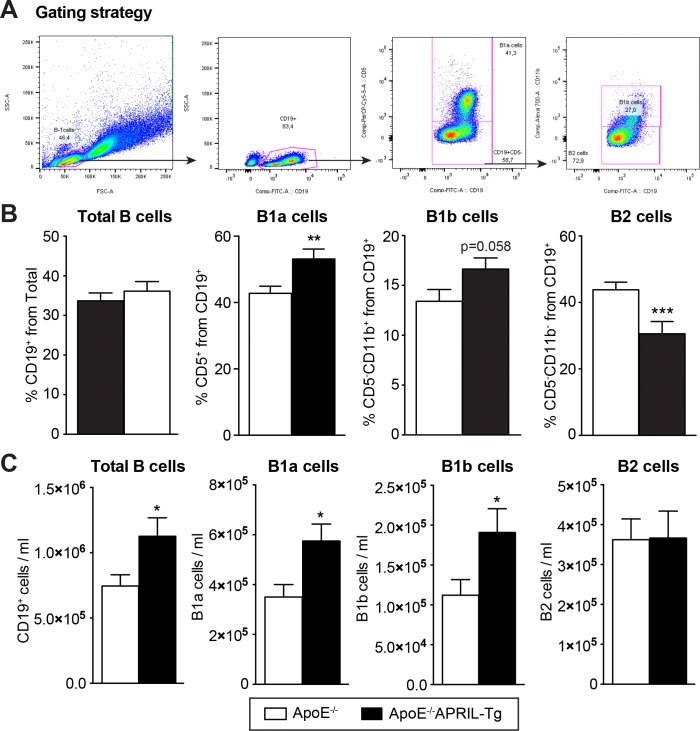
Fig 5. Peritoneal B cell subsets of ApoE-/- and ApoE-/-APRIL-Tg mice.
Peritoneal B cell subsets were quantified by FACS analysis after 12 weeks of WTD in ApoE-/- (n = 13) and ApoE-/-APRIL-Tg mice (n = 10). The cells were gated (A) for Lymphocytes in the FSC/SSC plot and B cells were selected on the basis of CD19 positivity. Subsets were identified as follows: CD5+CD11b+B1a cells, CD5-CD11b+ B1b cells, and CD5-CD11b- B2 cells. The percentages (B) and concentration (C) of CD19+ cells, as well as for each B cell subset are shown. Data are represented as mean±SEM; *p<0.05 **p<0.01 ***p<0.001.

