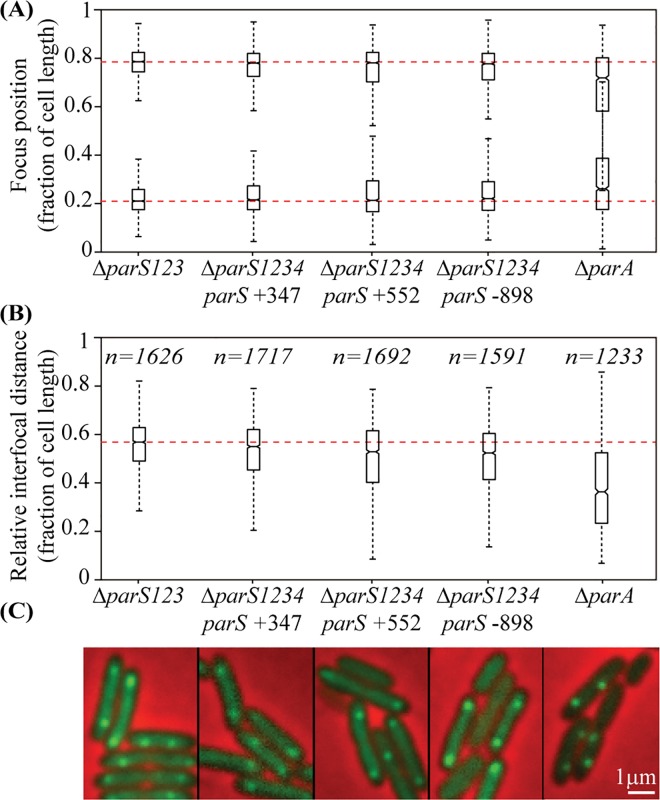
Fig 3. ParB binding to parS in the presence of ParA induces its positioning to the 0.2/0.8 relative cell length.
The pPSV38-NGFP-ParB plasmid was introduced in different strains, and NGFP-ParB localization was observed in cells grown in minimal medium supplemented with citrate. Foci numbers for each strain are indicated in S2 Table. (A) represents the localization of the 2 foci in cells (randomly oriented) containing two foci, for each genetic background, whereas (B) represents the distance between the two foci. Boxplot representations are used, indicating the median (horizontal bar), the 25th and the 75th percentile (open box) and the rest of the population except for the outliers (whiskers). Outliers are defined as 1.5×IQR or more above the 75th percentile or 1.5×IQR or more below the first 25th percentile quartile. Representative images are shown in (C). Scale bar is indicated. Raw data are presented in S5 Fig. Strains IVGB469 (ΔparS123), VLB66 (ΔparS1234 parS +347), IVGB480 (ΔparS1234 parS +552), VLB69 (ΔparS1234 parS -898) and IVGB317 (ΔparA) were used.

