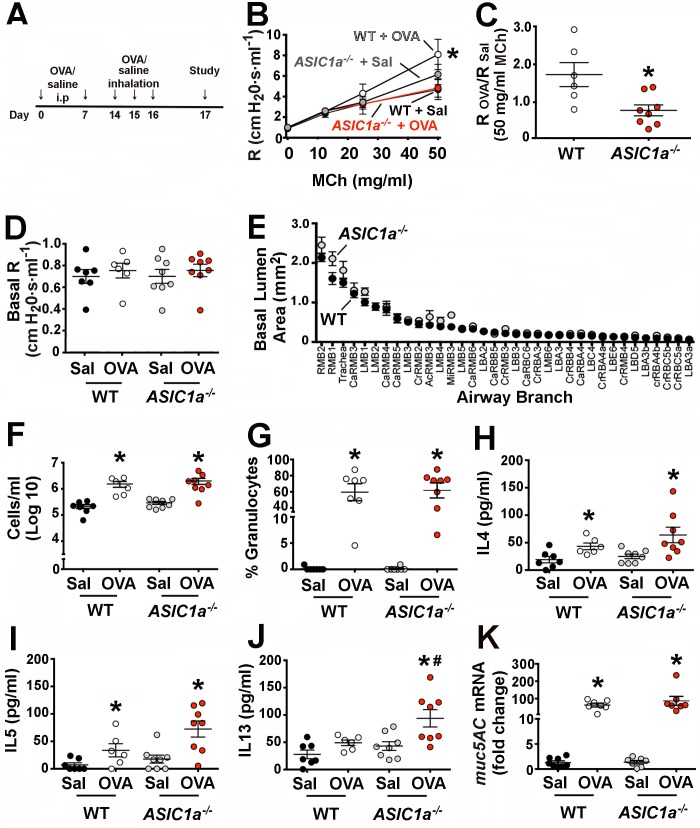
Fig 2. Loss of ASIC1a prevents airway hyperreactivity.
A) Male mice (8–9 weeks-old) were sensitized by intraperitoneal injection of 10 μg of OVA (Sigma) mixed with 1 mg of alum in 0.9% saline on days 0 and 7. Control mice received saline with 1 mg of alum at day 0 and 7. On days 14–16, mice were nebulized with either 1% OVA or 0.9% saline for 40 min in a chamber. B) Airway resistance (R) was measured by flexiVent in OVA-sensitized wild-type and ASIC1a-/- mice before and following administration of increasing doses of methacholine. Data are mean±SEM. WT + Sal, n = 7 mice; WT + OVA, n = 6 mice; ASIC1a-/- + Sal, n = 8 mice; ASIC1a-/- + OVA, n = 8 mice. * indicates p = 0.043. C) Ratio of airway resistance after administration of 50 mg/ml methacholine in OVA-sensitized mice compared to non-sensitized mice. A ratio of 1 indicates that airway resistance of OVA-sensitized and non-sensitized mice was the same. * indicates p = 0.012. Ratios for ASIC1a-/- mice were not statistically different from one (p = 0.18). D) Baseline airway resistance (R) prior to administering methacholine. p = 0.89. E) Airway measurements obtained from micro-CT scans. Data are mean±SEM area for 35 different airways. Airways are shown according to size. References to abbreviations and methods are in the Methods section. WT, n = 4 mice; ASIC1a-/-, n = 5 mice. p = 0.35. F) Number of cells in bronchoalveolar lavage fluid from non-sensitized and sensitized mice. For WT + Sal vs. WT + OVA, * indicates p = 0.004; for ASIC1a-/- + Sal vs. ASIC1a-/- + OVA, * indicates p = 0.006. G) The percentage of granulocytes in bronchoalveolar lavage fluid. For WT + Sal vs. WT + OVA, * indicates p<0.0001; for ASIC1a-/- + Sal vs. ASIC1a-/- + OVA, * indicates p<0.0001. H) Levels of IL4 in bronchoalveolar lavage fluid. For WT + Sal vs. WT + OVA, * indicates p = 0.03; for ASIC1a-/- + Sal vs. ASIC1a-/- + OVA, * indicates p = 0.018. I) Levels of IL5 in bronchoalveolar lavage fluid. For WT + Sal vs. WT + OVA, * indicates p = 0.049; for ASIC1a-/- + Sal vs. ASIC1a-/- + OVA, * indicates p = 0.005. A Pearson’s normality test showed that IL5 values in the ASIC1a-/- OVA-sensitized mice do not differ from a normal distribution. (J) Levels of IL13 in bronchoalveolar lavage fluid. For WT + Sal vs. WT + OVA, p = 0.054; for ASIC1a-/- + Sal vs. ASIC1a-/- + OVA, * indicates p = 0.013; for WT + OVA vs. ASIC1a-/- + OVA, # indicates p = 0.036. A Pearson’s normality test showed that IL13 values in the ASIC1a-/- OVA-sensitized mice do not differ from a normal distribution. K) muc5AC mRNA in mouse airways. For WT + Sal vs. WT + OVA, * indicates p<0.0001; for ASIC1a-/- + Sal vs. ASIC1a-/- + OVA, * indicates p = 0.018. For all panels, individual points represent data collected from a single mouse. Bars and whiskers indicate mean±SEM. Abbreviations: OVA, ovalbumin; Sal, saline; WT, wild-type; ASIC, acid-sensing ion channel; MCh, methacholine.

