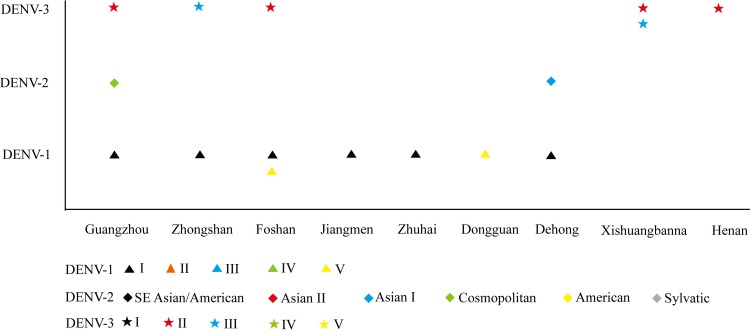
Fig 4. The genotypes of each serotypes detected in dengue outbreak locations, China, 2013.
The horizontal axis represented the outbreak locations and the vertical axis represented the genotypes in each serotypes. The shapes represented different serotypes and the colors in each serotype represented different genotypes.

