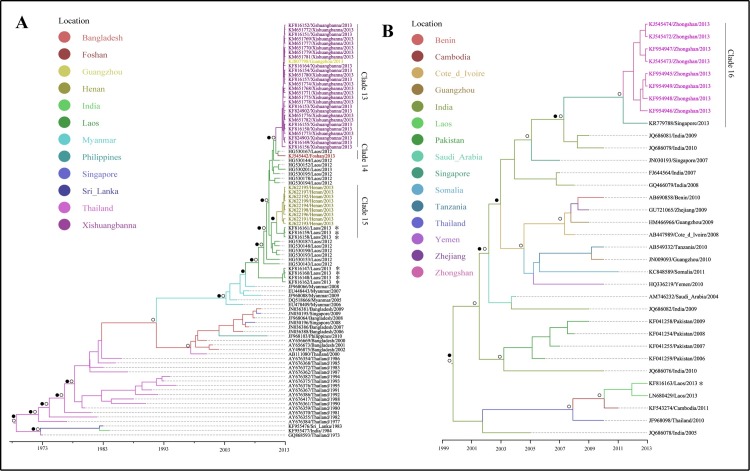
Fig 8. Maximum clade credibility (MCC) trees summarized for DENV 3.
A, B represented the MCC trees of genotype II and genotype III, respectively. The colors of the branches corresponded to their probable geographic location (see the legend). Labs with colors represented strains detected in outbreak areas in 2013. Circles indicated posterior probability support ≥ 0.8. Black dots indicate ancestral location state probability 0.8. Asterisk represented the strains introduced from overseas.

