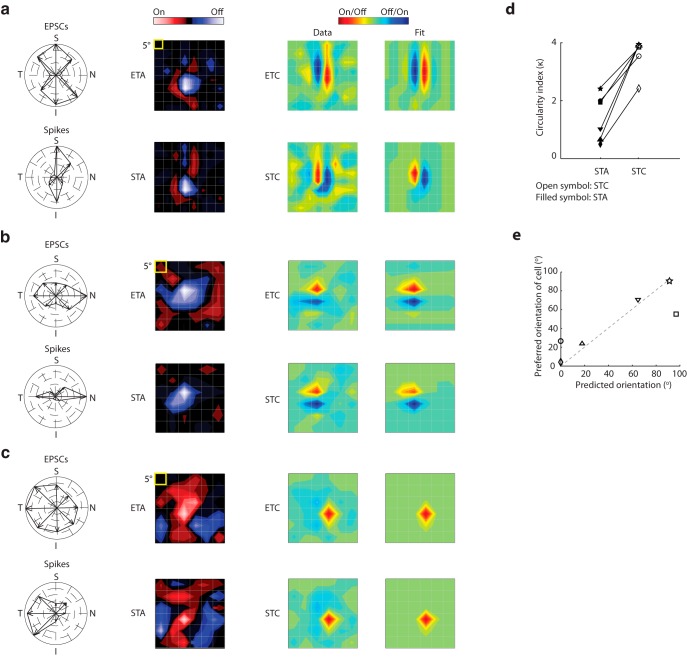
Figure 10.
Receptive fields of orientation-selective cells have elongated higher-order subunits. a, From left to right, Polar plot; first-order (ETA) subunit of the receptive field; second-order (ETC) subunit of the receptive field; and the fit of the ETC computed from EPSCs (top) and spikes (bottom) for an On-Off cell tuned to the vertical orientation. The color code for ETC/STC is different from ETA/STA because covariance analysis does not discriminate between the On and Off subregions. b, Same as in a, but for an On-Off cell tuned to the horizontal orientation. c, Same as in a, but for On-Off cell tuned for movement in the temporal direction. d, Before and after plot of values of an index that compares the shape of the receptive field subunits with a perfect circle; the lower the value, the more circular the subunit. Index values for each cell are plotted with a unique symbol: open represents STC; filled represents STA. e, Scatter plot of the preferred neural orientation against the orientation of the STC subunit, with symbol shapes as in d. Dashed gray line indicates unity slope.

